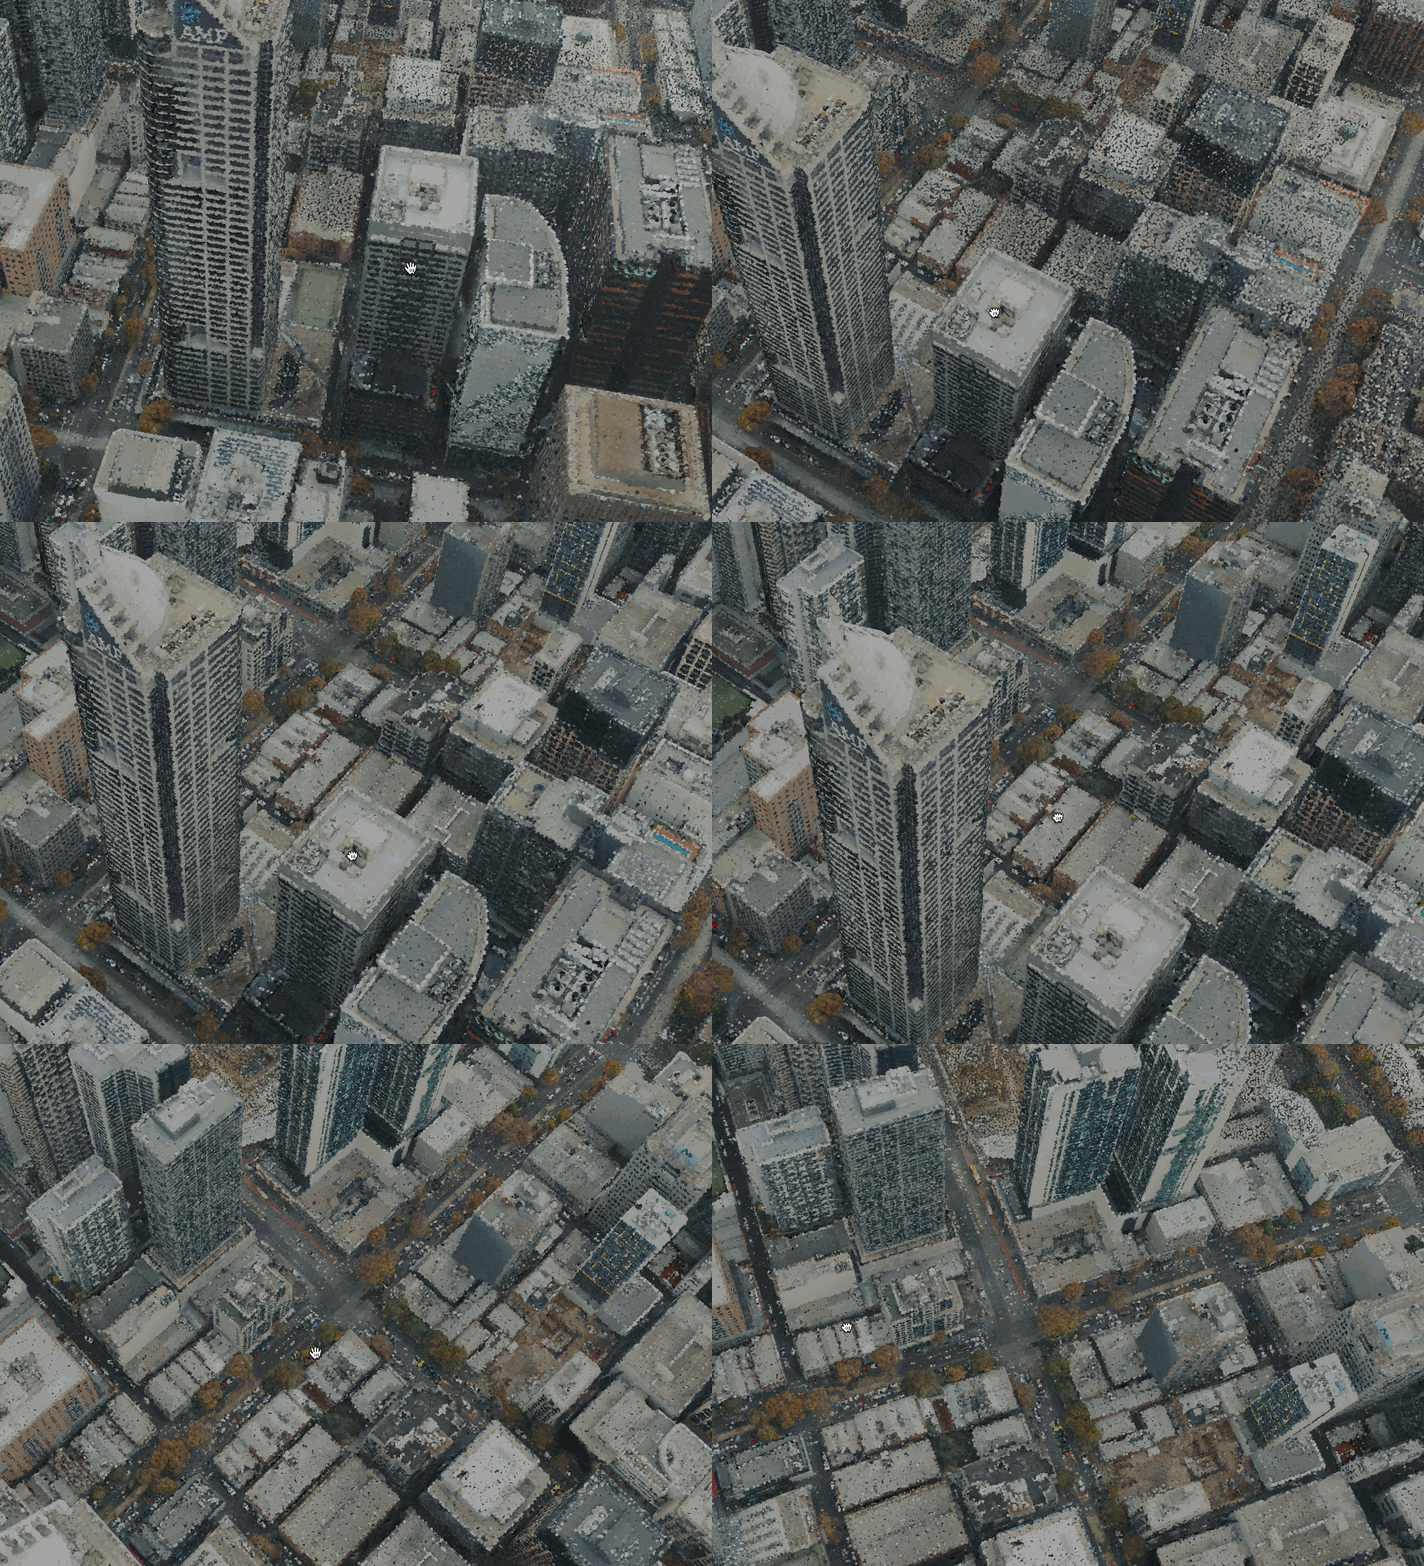
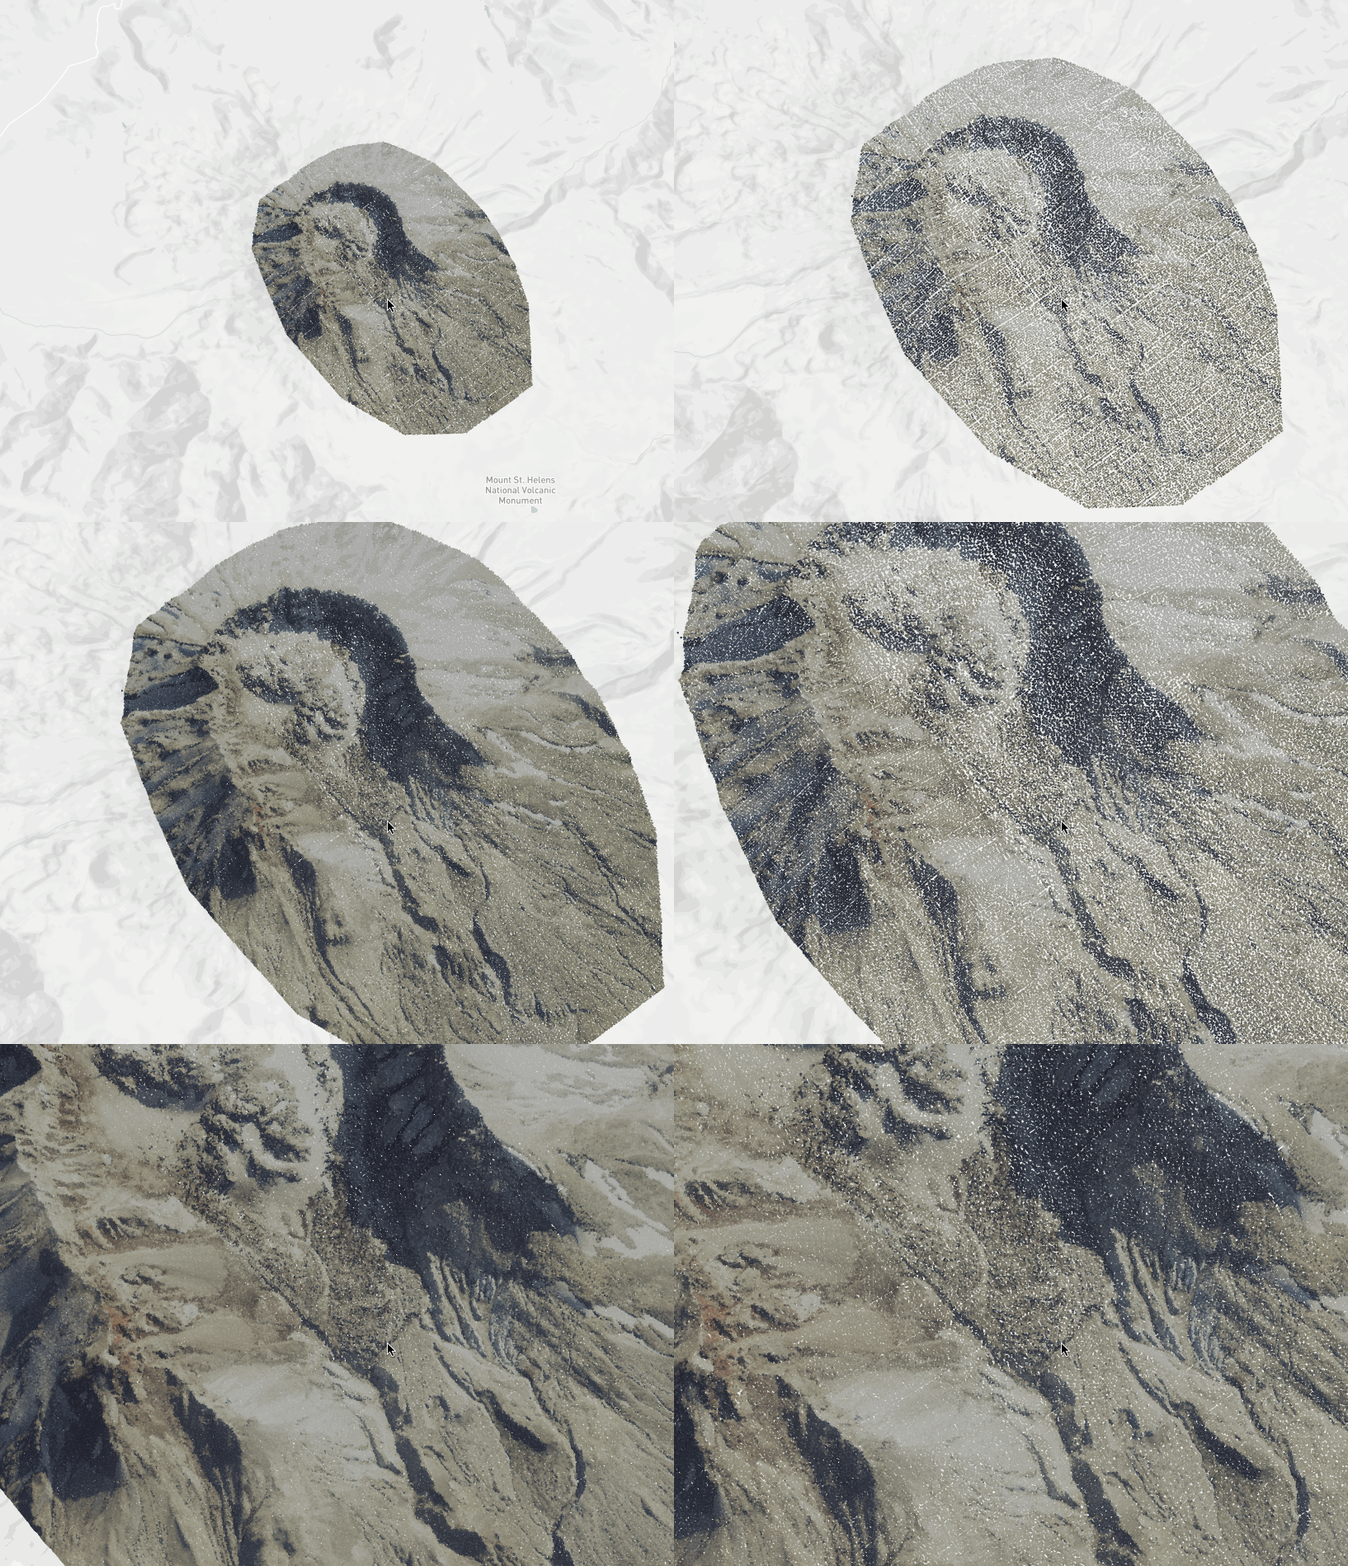
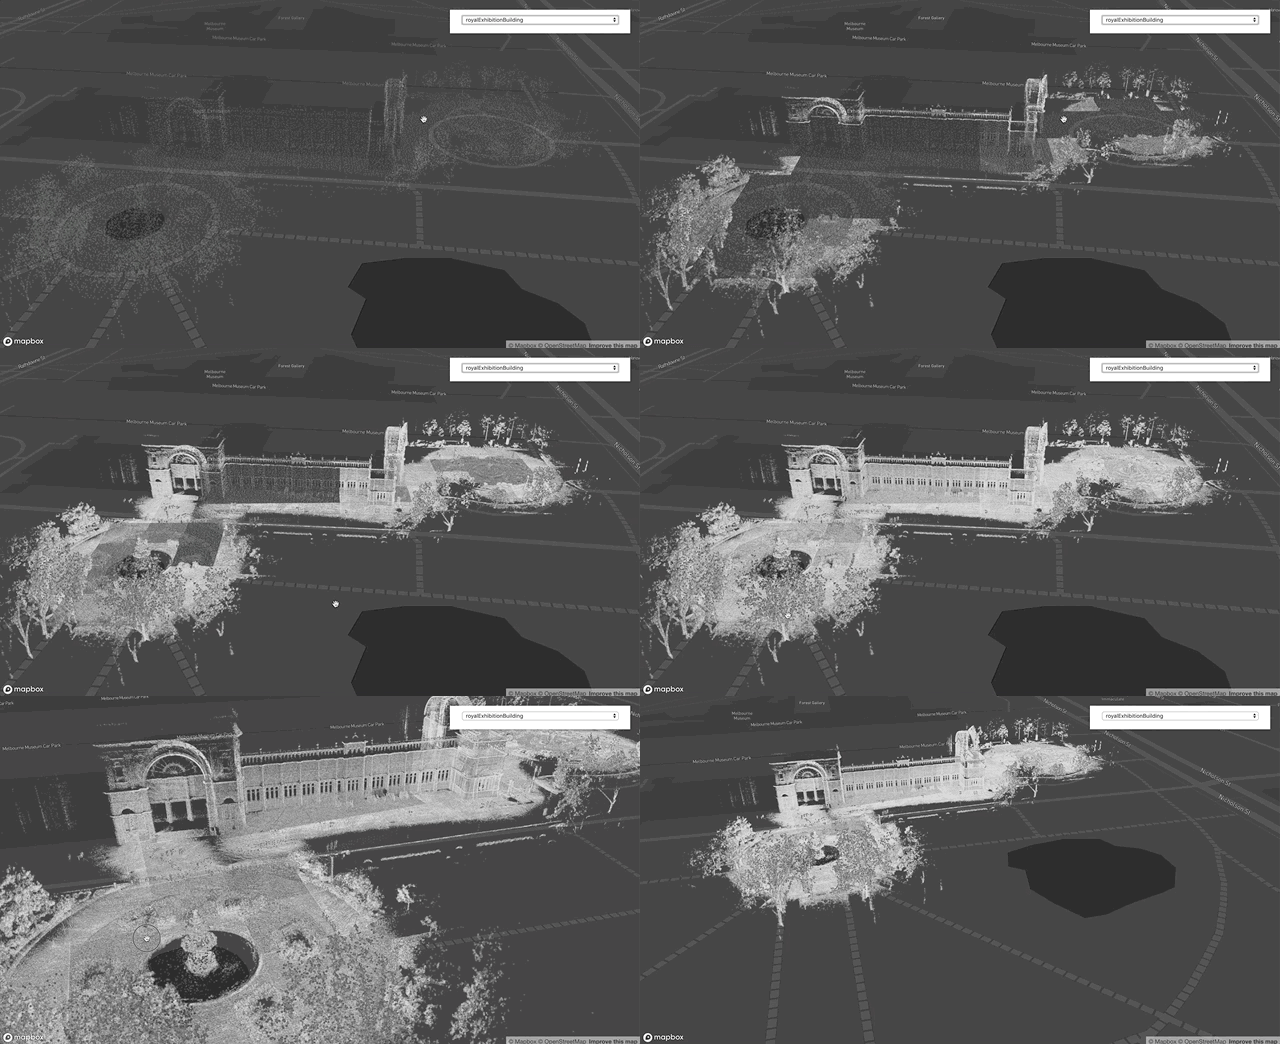
Taking City Visualization into the Third Dimension with Point Clouds, 3D Tiles, and deck.gl
October 29, 2019 / Global
To better understand Uber’s aerial ridesharing and business data in the context of urban mobility, our engineers and data scientists routinely visualize large geospatial data sets. One of Uber’s primary tools for working with these data sets is deck.gl, our open source web-based geospatial visualization framework. Highly GPU-accelerated, deck.gl is capable of fluidly visualizing and animating several million data items on modern laptop computers.
However, the size of geospatial data sets is growing rapidly and is already several orders of magnitude bigger than what many open source visualization tools can handle. Accordingly, the Uber Visualization team has been looking for technologies that would enable visualization of even bigger data sets in the browser.
One option we assessed for this task was 3D Tiles, a technology developed by Cesium that lets applications stream in only those parts of large geospatial data sets that they need to render a specific view at the desired level of detail. This technology reduces the amount of data that needs to be loaded and displayed at any given time with several orders of magnitude, and it quickly became clear to us that 3D Tiles would be an excellent tool to help render our massive point clouds.

In collaboration with the engineering team at Cesium, we leveraged deck.gl and loaders.gl, our open source suite of loaders for big data visualization, and 3D Tile technology, to develop a way for teams at Uber to quickly and seamlessly render large-scale data sets for enhanced visualizations that feature rich, city-scale point clouds. With these visualizations, we can better understand and thus serve the urban communities that use our transportation and delivery solutions.
Geospatial data at scale
Uber harnesses visualizations to provide insights about the ways cities move, giving us the knowledge necessary to improve user experiences on our platform. Large geospatial data sets power these visualizations, and can be roughly measured by their number of “features” (which for point clouds will be “points”):
-
- City scale data: ~hundreds of millions of features (e.g., point cloud of a city’s buildings).
- Country scale data: ~one trillion points features (e.g., the Netherlands, which is made up of 640 billion points).
- Continental scale data: ~tens of trillions of points (e.g. the USGS / Entwine visualization)
The size of these data sets depends on how much detail is captured per area unit, and this is likely to increase in the future (as processing power and storage capacities increase).
To understand these data sets and how they reflect the cities we live in, our team turns to visualization. In addition to being aesthetically stunning, the wealth of geographic detail in these data sets provides many valuable insights on their own. And more importantly, they serve as a powerful backdrop onto which traditional geospatial data visualizations can be superimposed, highlighting correlations and causal relationships that are not evident when just looking at the data and a flat base map.
3D tile technology lets us break through the million point barrier in current GPU renderers and lets us incrementally load these massive data sets that are many orders of magnitude larger than what can be visualized with traditional methods, while still allowing fluid 3D visualization in our web browser.
Uber Air network planning
Figure 2. We can visualize Uber Air simulated flights at scale with Uber’s internal visualization suite.
Aerial ridesharing can improve transportation in cities around the world by unlocking mobility bandwidth in the third dimension. However, designing optimal aerial ridesharing networks, airspace management solutions, and operational aids requires a robust 3D visualization framework.
3D Tiles can present massive geospatial data sets in a meaningful way for Elevate, Uber’s aviation initiative. Initial 3D point clouds of downtown Melbourne (an Uber Air international launch city) show the potential of visualization in improving Uber Air network design. With it, we can more rapidly consider 3D obstructions and validate safe departure and approach pathways.
Visualizing urban landscapes is only the beginning. In the future, we plan to extend our visualization capabilities to include natural terrain, airspace rules, existing air traffic, and many more data sets key to unlocking a network strategy that can be deployed at scale.
Our vision is ambitious but achievable in the next decade with the help of regulators, vehicle designers, communities, infrastructure partners, cities, and network operators. With 3D Tiles, we are better equipped to seamlessly integrate Uber Air into our communities.
3D Tiles overview
3D Tiles technology solves the data scale problem in a conceptually simple way, as it allows big data sets to be segmented into a spatial hierarchy of tiles, such that only tiles that are visually significant from the user’s current vantage point are loaded and rendered. As a user zooms in, they no longer need to look at the tiles around them, instead, peering deeper into the spatial hierarchy of tile sets, which reveals tiles with increasingly fine detail.

For those interested in learning more about how this technology works, there are a number of available online resources that explain the concepts around the spatial hierarchy that underpins 3D Tiles.

3D Tile formats
We chose to start with implementing the OGC 3D Tiles community standard (because of the availability of open source CesiumJS code to use as a starting point, and the support provided by Cesium), but this is not the only available format. In fact, there are multiple companies and even individuals working on developing 3D tile style formats.
To date, the OGC (Open Geospatial Consortium) has two complementary 3D Tiles standards:
-
- The Cesium-driven 3D Tiles standard
- The ESRI-driven i3s (Indexed 3D Scene Layers) standard
These two standards were developed independently but cover similar feature sets that not only support point clouds but also textured geometries and even “architectural building layers” that can provide the interior structure of buildings to support “digital twin” type use cases.
In addition, there are also several simpler, point cloud-only tile formats:
-
- the potree specification, a simple but powerful format with a popular viewer,
- the “archival focused” Entwine Point Tile (EPT) specification,
- and surely others which we have yet to discover.
loaders.gl as a multi-format 3D Tiles loader
The 3D Tiles space is abuzz with a steady stream of developments. New tile types are added at a regular cadence to the existing standards and we may even see the introduction of new tile format specifications to cover specialized use cases.
In tandem, tile generation pipelines and backends are rapidly becoming more sophisticated and we expect them to soon be able to convert between tiles of different formats, perhaps even on-demand as tiles are requested.
Even so, there is value in having a client-side application that can directly load multiple formats.
Uber’s open source loaders.gl architecture is designed for this situation. It provides:
-
- A light abstraction layer for data loaders that allow loaders for similar data formats to be exposed as pluggable and interchangeable components
- A framework-independent loader API which makes it almost trivial to add 3D tile format loading support to any WebGL rendering framework

As part of this effort to enhance loaders.gl, we are engaging with the WebGL and geospatial communities to collaborate around building out additional formats and renderers, as shown in Figure 5, above.
Uber + Cesium: an open source collaboration

Recognizing the benefit of this possible collaboration, the Cesium engineering team not only endorsed and provided advice to our loaders.gl effort, but also committed engineering resources to loaders.gl to support 3D Tiles loader development.
Our development approach
Implementing a reusable production-quality loader for any major data format is not trivial. A working, proof-of-concept implementation of 3D Tiles can be done relatively quickly.
However, an industrial strength implementation that will be maintainable over the long term requires build tooling, documentation, test coverage, and examples. Ideally, implementation should also come with benchmarks enabling regression testing and continuous optimizations of the traversal algorithms, for instance, data loading, request scheduling, and caching.
Leveraging the Cesium codebase
Developing a complete production quality loader from scratch would have been a major undertaking, but we were able to accelerate the development considerably through Cesium’s help.
The CesiumJS client-side codebase is open source, and essentially provided us with a full production-quality reference implementation of the 3D tiles specification, together with test tile sets and unit tests.
In many cases, we just needed to separate already existing loading and traversal components from any Cesium-specific rendering code. As we did so, we added the framework-independent equivalent of the original Cesium code to loaders.gl and math.gl.

Building the loaders.gl community
One of our main goals for building and open sourcing loaders.gl is to reduce duplicated development work between developers, and as a result, free up more resources to build new solutions and innovate on top of technologies like 3D Tiles.
Contribution opportunities
We are continuing to iterate on the loaders.gl framework with the goal of making it generally useful to the data visualization and 3D communities, and we welcome feedback and contributions to loaders.gl. Here are several areas where we are actively seeking to contributions and collaborations:
Support for additional formats
If you are working on a different data tiling format and would like to add a parser module for your format as a pluggable loaders.gl module, please let us know. Similarly, if you are working on any file format parser for a format that you think might fit within the loaders.gl scope, do not hesitate to reach out via a GitHub issue.
Support for additional WebGL frameworks
Examples showing how to integrate loaders.gl with other WebGL frameworks are extremely welcome, as they will help users get started with loaders.gl on those platforms. In particular, the 3D Tiles loader needs a bit of glue code with the 3D framework that may be more than what casual users are willing to develop on their own.
Traversal refinement
Most of the real magic in 3D Tiles lies in traversal algorithms, such as tile selection heuristics, together with loading and caching optimizations.
In addition, there is always some work left to do: the loaders.gl 3D Tiles implementation does not yet implement every feature in the 3D tile standard, and loading tile sets from new sources occasionally uncovers an unforeseen implementation issue.
Moving forward
In the future, we’d love to see the 3D Tiles implementation in loaders.gl become a reference client-side implementation that supports multiple formats and renderers and keeps pace with the latest 3D Tiles technology.
How far we move towards that vision will depend partly on whether we get additional adopters. Work on internal Uber Elevate simulations and network design will continue to advance practical implementations of 3D Tiles, and every 3D framework or application that starts using this implementation to load 3D Tiles will provide additional momentum to our project.
We also hope that the loaders.gl effort will serve as an example and an inspiration for how WebGL code can be built in a reusable, framework-independent way, and how choosing to develop technology stacks as open source can enable powerful, mutually beneficial industry collaborations that would otherwise be difficult to achieve.
Implementing support for loading pre-tiled data sets is only the beginning for us. We are actively exploring new ways to use this as a foundational technology, perhaps using dynamic tiling approaches to enable on-the-fly visualize data sets that are too big for WebGL.
To learn more about how to use 3D Tiles with the Vis.gl suite, visit our project site, and to contribute to the loaders.gl project, check out its GitHub repository.

Ib Green
Ib Green is a staff software engineer on Uber’s Visualization team.

Chris Gervang
Chris is a senior software engineer on Uber Elevate’s System Simulation platform team. He develops Flux, Elevate’s operation and network design framework, and Hubble.gl, an animation library for 3D visualization.

Ian Villa
Ian is the System Simulation Lead at Uber Elevate. He works with the team to develop integrated market simulations of networks, skyports, and aircraft across Uber’s aviation products. Previously, Ian was the technical lead for aircraft partnerships at Uber Elevate.
Posted by Ib Green, Chris Gervang, Ian Villa