
The App Size Problem
Uber’s iOS mobile Apps for Rider, Driver, and Eats are large in size. The choice of Swift as our primary programming language, our fast-paced development environment and feature additions, layered software and its dependencies, and statically linked platform libraries result in large app binaries. Reducing application size is critical to our customer experience. Moreover, Apple’s app-download-size limitations prohibit large app downloads over the air.
App-download-size restriction means first-time users cannot download the app when they need it the most, and Uber cannot deliver features, promotions, or security updates to existing users when they are not on Wi-Fi. We established a correlation between the Uber Rider app size and customer engagement — when the app size crosses the download size limit, and it leads to a 10% reduction in app installations, 12% reduction in sign-ups, and 20% reduction in first-time bookings, resulting in revenue loss. Over the past three years, the Uber Rider app’s size has often approached the App store’s over-the-air download limit, and staying below it is a clear priority.
In the following article we will describe how we reduced the code size of Uber’s iOS Rider app by 23% using advanced compiler technologies. The ideas discussed herein also translated to 17% and 19% code size savings in the Uber Driver and Uber Eats iOS apps, respectively.
Objectives
We set out to reduce iOS app size at Uber with the following objectives:
- Bring the size to be well under the App Store download limit–smaller the better
- Choose size-reduction optimization(s) that continuously deliver impact for the foreseeable future as the app evolves
- Be transparent so that application developers are not asked to divert their energies towards size reduction
- Do not regress the performance of critical use cases
- Do not increase local build times, which are a critical factor for developer productivity
An Insight into the Uber Rider App
The Uber Rider app is written in a mix of Swift and Objective-C programming languages. The app has a couple of millions of lines of code with the vast majority in Swift. The source code consists of about 500 swift modules including third-party libraries. The Driver and Rider apps have similar, but slightly different characteristics. We will focus on the Uber Rider app as our canonical example.
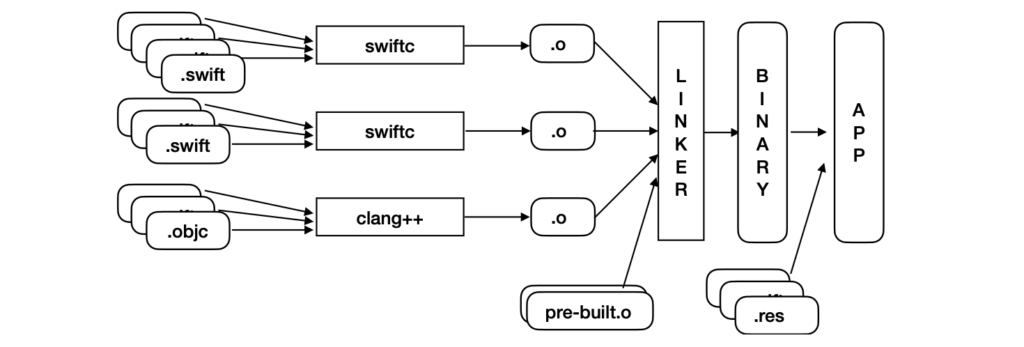
Figure 1 depicts the default build pipeline used by iOS applications, including that of the Uber Rider app, prior to the work described here. The workflow involves compiling all the source files in a module to produce an ARM64 object file. Several such modules are independently compiled. Since the Uber Rider app is multilingual, it also compiles Objective-C files separately into object files. All object files, including any pre-built binaries, are linked with the system linker (ld64) into the final binary. The app itself may package additional resources. Individual modules are compiled using the whole-module optimization in the Swift compiler, which performs interprocedural optimizations within a module. We use the -Osize flag to produce a size-optimized binary.
We employ several linting rules to guard against binary size explosion, which include avoiding large value types (e.g., struct and enum), restricting access control levels to the lowest (e.g., avoid public and open accesses when possible), avoiding excessive use of generics, and using final attributes. We employ several in-house static analysis tools for removing dead-code and resources and disabling reflection metadata to reduce binary size.
Although these techniques together reduce the app’s size somewhat, they are outpaced overall by our fast-growing code base. Opportunities for cross-module optimizations are still left unexplored, and is therefore the focus of this article.
At the Binary Level
Over 75% of the Uber Rider app binary is the machine instructions. We systematically investigated the patterns of these machine instructions and found out that a vast amount of machine instruction sequences repeat frequently.
Instruction-Sequence Replicas and Their Traits
Single instruction replicas are abundant in any binary, but they cannot be replaced profitably on a fixed-instruction width architecture (RISC) such as ARM64; the cost of replacing an instruction clone is higher than retaining the original instruction.
On the other hand, instruction patterns of length two or more can be profitably “outlined”. That is, we can substitute a sequence with a shorter sequence, typically a single call or an unconditional branch instruction to a single occurrence of the pattern. This requires transferring the control to an outlined instruction sequence that effectively executes the original sequence of instructions and then resumes at the instruction immediately following the original sequence.
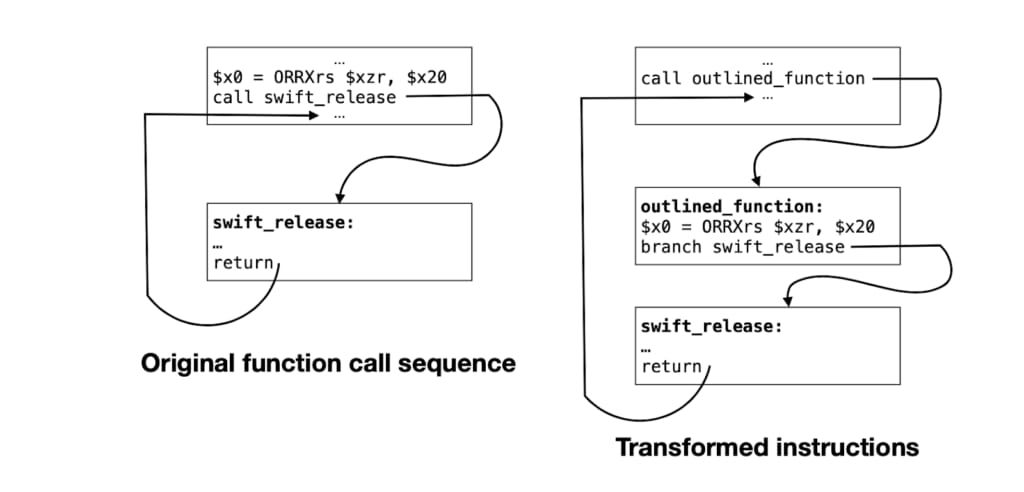
Figure 2 shows an example of a highly repeating instruction sequence found in the Uber Rider app. The sequence first copies the contents of the general-purpose CPU register $x20 into register $x0 via a bitwise OR with the zero register $xzr. The next instruction calls the “swift_release” function. The value in $x20 is an object whose reference needs to be released.
These two instructions can be replaced with a call instruction to a newly created outlined_function; the outlined_function executes the prefix instruction(s) and finally tail-calls the original function, swift_release.
If such a 2-instruction pattern appears 1 million times (which is 8 million bytes for instructions of 32-bit size), the transformation cuts those 2-instruction sequences down to 1-instruction (which makes for a total of 4-million bytes), with 2 extra instructions in the outlined_function — a saving of almost 50%. Such patterns ending with a call or a return instruction are the most common, accounting for 67% of all the repeating candidates that we can profitably edit in the Uber Rider app.
Machine-code sequences repeat frequently, and the frequency of repetition follows the power-law curve.
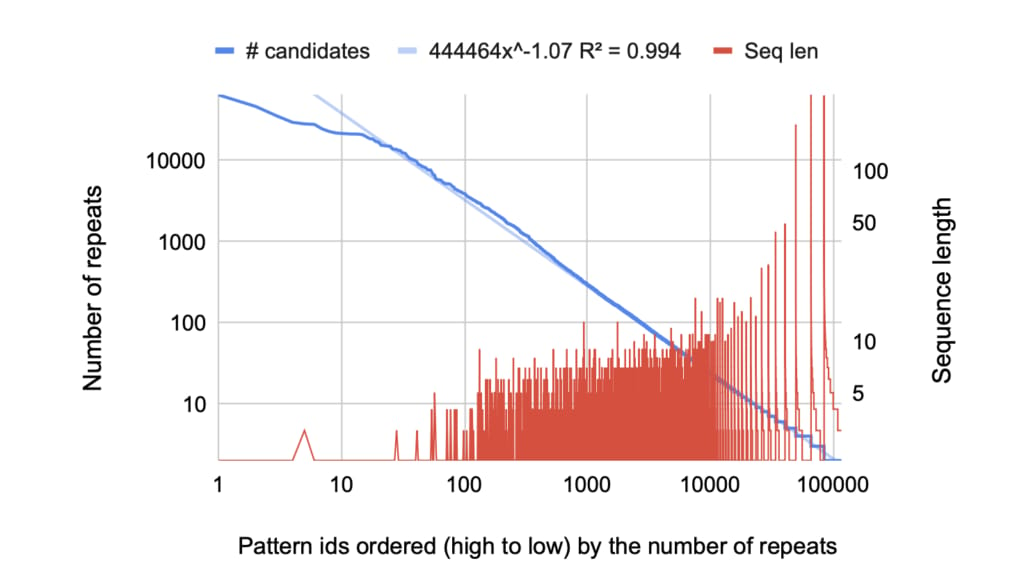
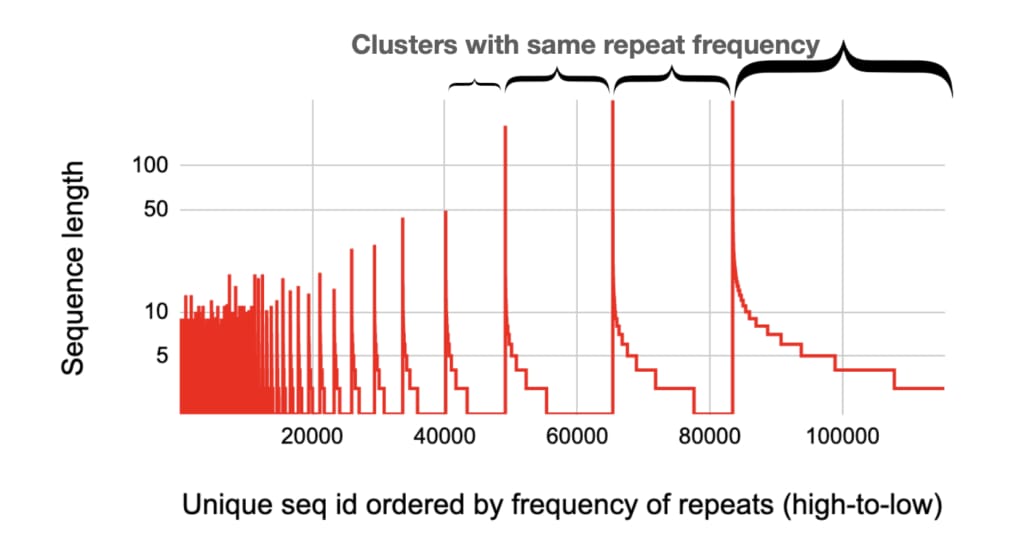
Figure 3 plots the frequency of repetition in machine-code sequences (blue line) overlaid with the sequence length (red line). The x-axis denotes the unique-id of each pattern where the highest occurring pattern is given an id 1, the next highest is given an id 2, and so on. It is a log-log graph. A few patterns repeat very frequently, but there is also a very long tail of patterns, each progressively repeating fewer times, which obeys the power-law (y = axb) with 99.4% confidence.
Figure 4 shows the same red line of Figure 3, however, the x-axis is not on the log scale. The red line reveals a recurring fractal pattern — frequently occurring patterns have a very short sequence length (left side); as the frequency of repetition decreases, the diversity of sequence lengths increases (right side). The data points from one spike to the next spike on the x-axis represent a cluster of patterns that repeat the same number of times; within each cluster, there are very few lengthy sequences, but as the sequence length reduces, a larger and larger variety of patterns emerge. Finally, comparing one cluster on the left (higher repetition frequency) with another cluster on the right (lower repetition frequency), it is obvious that, as the repetition frequency decreases, both the variety of patterns (the length of horizontal steps) and sequence lengths (the height of spikes) increase.
While power law and fractal patterns have revealed themselves in several physical, biological, and man-made phenomena, to our knowledge we are the first to identify their presence in machine-code sequences in computer executable code. Presumably, machine code is a human expression of instructions to a computer and it is well established that all human languages show a power-law in the frequency of the words.
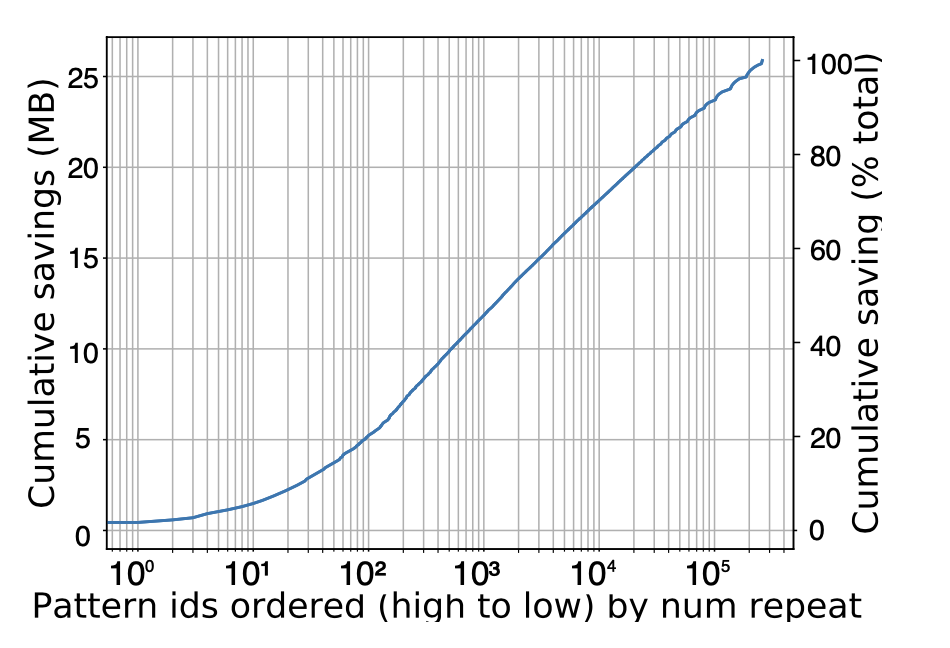
Figure 5 plots the cumulative size savings possible by outlining the next most profitable pattern (x-axis). A lot of patterns (> 105) need to be outlined to extract most (> 90%) of the possible size gain. One cannot “hard-code” a few patterns and hope to gain a significant benefit.
What Causes Instruction-Sequence Repetition
- High-level language and runtime features related to reference counting and memory allocation are common causes of the most frequently repeated patterns.
The top few frequently appearing patterns in Listings 1-6 are all related to language and the runtime specifics — reference counting and memory allocation of Swift and Objective-C.
Since both Swift and Objective-C are reference counted, instructions to increment (swift_retain and objc_retain) and decrement (swift_release and objc_release) references are highly frequent. Consider Listing 1 as an example: the first instruction moves the value present in register $x20 to register $x0 by performing a bitwise OR operation (ORR instruction) with the zero register $xzr. The second instruction (BL) invokes swift_release, which decrements the reference count of the heap object held in the argument $x0. In this example, the pointer to the heap object was originally present in $x20 (source register), but it had to be moved to $x0 (destination register) to meet the calling convention which expects the first argument in $x0.
Register assignment choices can lead to many repeated patterns — for example, Listings 1 and 2 differ only in their source registers. Over the entire program binary, these patterns can occur many times. There are many possible targets for a function call instruction, and hence each one contributes to a unique 2-instruction pattern. Finally, the callee can expect more than one argument (e.g., swift_allocObject in Listing 3 expects 3 arguments); hence, the destination register can also be different and be reordered by the instruction scheduler, which also contributes to several 2-instruction patterns.
2. The generous use of novel, high-level language features and their corresponding code generation contribute to certain, very long and undesirable repeated patterns. We elaborate more on this with two examples.
a. Generic functions and Closure specialization: Swift supports generic functions and closures. Generic function instantiations and closures specialized at their call sites result in highly similar, long sequences of machine instructions.
b. O(N2) code blow-up from try expressions.
Listing 7: A typical idiom in Swift to construct an object by deserializing from JSON. The try expression can throw an error.
Listing 7 above shows a common idiom recommended by Swift to use the try expressions to deserialize JSON data and assign to properties of a class. In this example, the class MyClass contains 118 properties, which are initialized from a JSON object. The initialization happens via try expressions, which throw Error if the property is not found in the incoming JSON object. If any one of the try expressions fails, all the previously created properties have to be released. When this code is lowered into LLVM IR and then into the machine code, it leads into N blocks of codes where the Nth block and N-1th bock have N-1 same instructions, N-1th and N-2th block have N-2 same instructions and so on — which is a O(N2) replicated code.
Solution via Advanced Compiler Techniques
It is clear that instruction sequences repeat, irrespective of the cause. We exploit the power-law nature of machine-code sequences to help in code-size reduction. In principle, any repeated sequence can be replaced by redirecting the execution at each repeated location to a single instance.
Hence, one may apply the aforementioned “outlining” technique to save size by replacing many instances of the same sequence with a function call via compile-time transformation. In fact, machine-code outlining is a transformation available in LLVM, and most recent Swift compiler versions enable it if the code is compiled for size.
However, we found that a naive application of machine outlining is not very beneficial. In the default iOS build pipeline, each module is converted into machine code. In this setting, if we perform machine-code outlining at each module level, there will still be replicas present across modules and moreover, we’ll miss the opportunity to find replicas that span across our 500 modules.
At Uber, we developed a compilation pipeline that could enable machine outlining to deliver benefits at the whole-program level. We further identified the limitations of machine outlining on how it misses opportunities, and developed repeated machine outlining to allow further code size reduction. The result was a significant code size reduction for the Uber Rider (23%), Uber Driver (17%), and Uber Eats (19%) apps, with no statistically significant performance regression and zero involvement from our feature team developers.
New iOS Build Pipeline
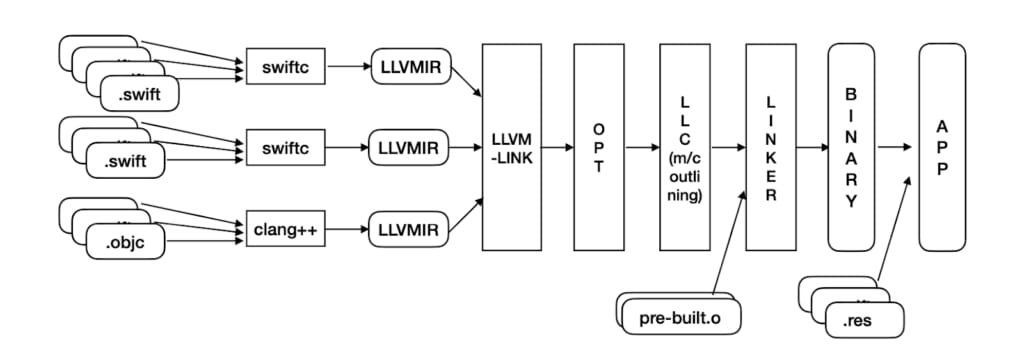
The new pipeline produces LLVM IR for each module in lieu of directly producing the machine code. It, then, combines all LLVM-IR files into one large IR file using llvm-link. Subsequently, it performs all LLVM-IR level optimizations on this single IR file using opt. We then feed the optimized IR to llc, which lowers the IR to the target machine code; during this phase, we enable machine outlining on the whole program. This ensures that:
- Maximum similarity is exploited while identifying candidate machine code sequences
- No outlined function is a clone of another outlined function, which would have been common had we performed only per- module machine outlining
The machine code is finally fed to the system linker along with any pre-compiled machine code to produce the final binary image.
Squeezing More Size with Repeated Machine Outlining
The machine outlining, as originally conceived in LLVM, employed a greedy heuristic to detect repeating patterns and ordered them by their immediate profitability rather than the global profitability over all repeating sequences. This is fundamentally the knapsack optimization problem, which is NP-hard. We noticed that the greedy heuristic squanders a significant size-saving opportunity. In Figure 7a, 2 sequences (BCD and ABCD) are potential patterns for outlining. Without the loss of generality, assume no overhead of outlining at the call site or frame overhead for the outlined function. LLVM’s MachineOutliner chooses BCD because it shows the maximum savings in the immediate next step: choosing BCD will shrink 8 × 3 = 24 instructions into 8 while introducing a new function of 3, for a total savings of 13 instructions; in contrast, choosing ABCD will shrink 5×4 = 20 instructions into 5 and introduce a new function of 4, for a total savings of only 11 instructions. Outlining BCD, shown in Figure 7b, reduces the code to a total of 16 instructions. Outlining ABCD, however, is more profitable in reality because it not only allows outlining ABCD first but also allows outlining BCD subsequently on the remaining candidates to reduce the total size to 15 instructions, as shown in Figure 7c. However, this cascading effect is not immediately obvious; clearly, the greedy algorithm implemented in LLVM is sub-optimal.

We addressed this issue by introducing repeated machine outlining in LLVM. The idea of repeated machine outlining is to use the greedy algorithm to choose the next most profitable pattern as before, but, instead of discarding lengthier candidates whose substrings are already outlined, we continue to iteratively apply the same algorithm on the new candidates, which now contain one or more calls to already-outlined patterns. Since MachineOutliner relies on up-to-date liveness information, we had to update the candidate’s liveness information after the call/branch instructions are introduced. Going back to our example, Figure 7d shows that the sequence AX can be outlined during the second repetition of outlining; the final size is 13 instructions — better than both alternatives. The number of repetitions should be tunable.
Repeated outlining offers practical benefits over the default greedy algorithm, providing 27% size savings over the default machine outlining on the Uber Rider app. Our evaluation shows that our app converges to an optimal code size after 5 rounds of machine outlining.
Bringing it to Practice
- Adoption. Overhauling the default build workflow with our custom workflow requires maintaining a local LLVM toolchain, which in turn requires buy-in from several stakeholders, including the Developer Experience, Testing, and Release teams. We tackled this by introducing a configuration flag to either enable or disable the new build pipeline, making it easier to roll back in the event of outages.
- Language interoperability. Two LLVM-IR files, one produced from the Swift compiler and another produced from the Clang compiler (for Objective-C), could not be merged into a single IR file via llvm-link because of a conflicting “Objective-C Garbage Collection” LLVM metadata flag being used by both compilers. Since our app is a mixture of Swift and Objective-C, this support was necessary. Previously the LLVM GCMetadata was a single value that encoded compiler major and minor versions and other bits. Hence, comparing all the bits arising from different compilers led to conflicts. We fixed it by breaking up the LLVM metadata into a set of “attributes”; later the link-phase only inspects the relevant attributes, ignoring the compiler that generated it. Thus, we eliminate the conflict.
- Performance regressions. On its own, llvm-link does not preserve the original order in which the data is present in each constituent module. When numerous modules are merged, the intermixing of data from disparate modules leads to data locality problems. Feature developers typically put all the data needed by a feature in its relevant module and place relevant data together, but llvm-link destroys this programmer-driven data affinity. We introduced a new data-layout ordering in llvm-link that honors the original module-specific ordering of data present in its constituent IR files even after merging. This optimization eliminated the performance regression.
- Debuggability. An outlined function cannot map its instructions back to any specific source location, since multiple source locations can map to it. After rolling out the new pipeline, when our developers were investigating bug reports, they were sometimes seeing an OUTLINED_FUNCTION_ID on top of their call stacks; they were misunderstanding the failures to be caused by the outlining optimization. Fortunately, the failure reports have access to the full call stacks, rather than just the leaf function. By inspecting a level deeper into the backtrace, the developers were able to debug the failure in their feature code.
Evaluation
Lifelong Code Size Savings
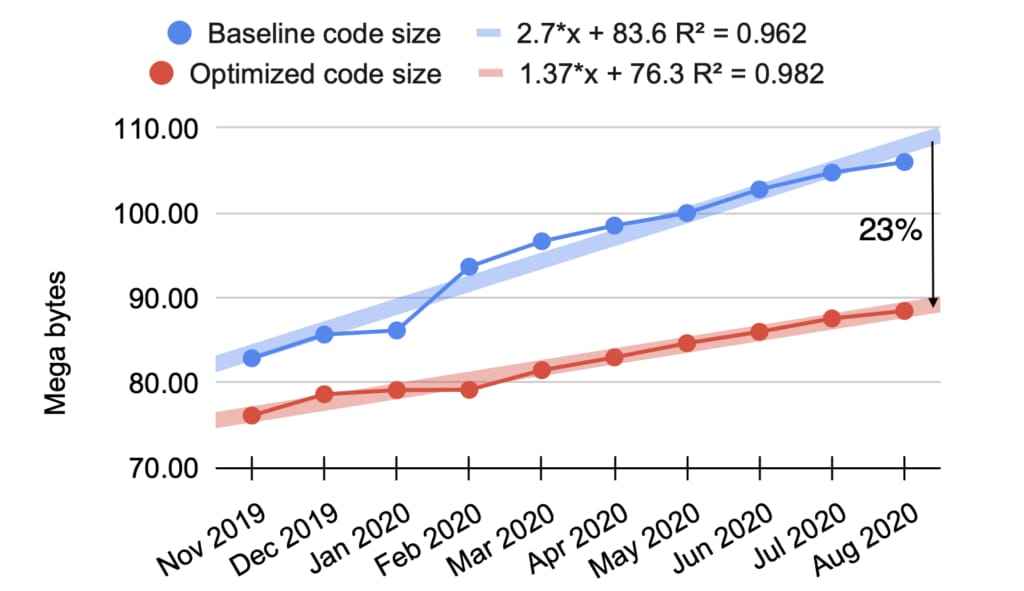
Our new pipeline finds more opportunities for binary-size reduction in a continuous development environment. Figure 8 shows the impact of all our optimizations on our app code bytes. In this figure, the baseline (blue) code is already optimized for size, but it uses per-module optimization and does not have repeated machine outlining (which represents the default iOS pipeline). Overall, we see a 23% size reduction.
The code size growth for the baseline fitted with the linear regression line has a slope of 2.7 (96% confidence). The code size growth with our optimizations (red line) has a slope of 1.37 (98% confidence). Hence, we reduce the code size growth by about 2×. We believe this “lifelong” code size impact is a significant benefit of the optimizations we developed.
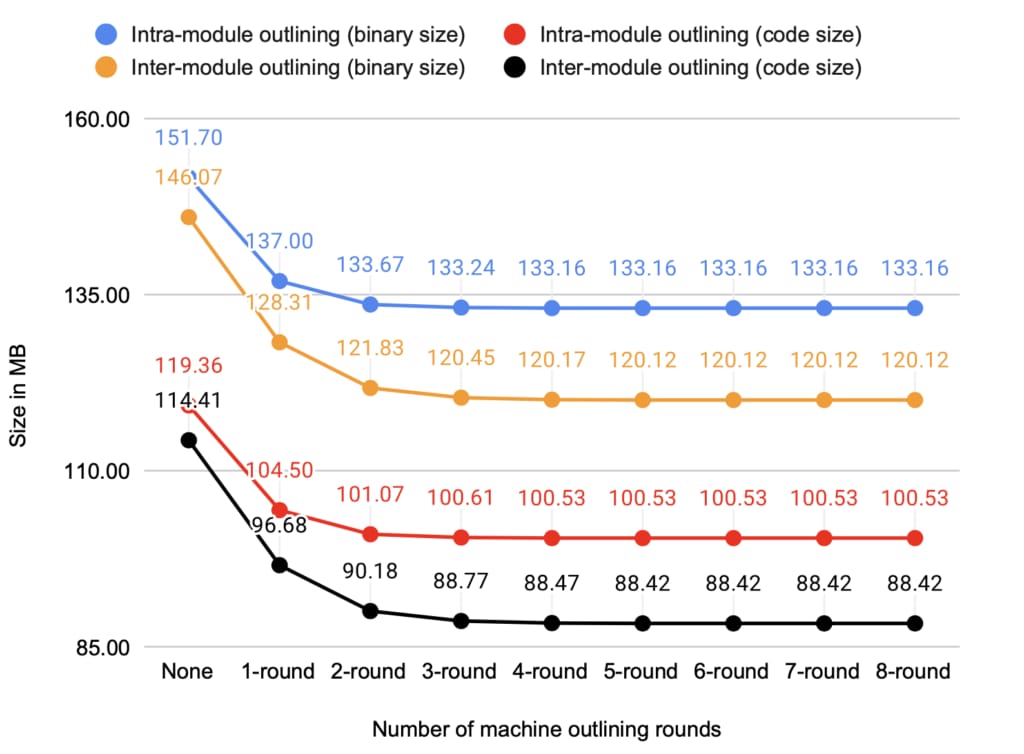
In Figure 9 the x-axis marked as None is produced by disabling machine outlining, however all other size-reducing optimizations in LLVM are enabled. Subsequent points along the x-axis progressively increase rounds of machine outlining.
First, comparing the whole binary size (the top two lines) with the code size (the bottom two lines) shows that the app binary size reduces proportionally with the code section size, because of repeated outlining. Five rounds of machine outlining in our new build pipeline produces a 120.1MB binary, which reduces the binary size by 17.6% compared with the default pipeline’s 145.7MB. The same produces a code section of 88.4MB, which is 22.8% smaller compared with 114.5MB in the default pipeline. Out of the 22.8% code size savings, 27% (7% points) is derived from repeated machine outlining.
Second, there is a continuous (but diminishing) size reduction with an increased number of machine outlining rounds. Also, the gains for the intra-module outlining plateau sooner than the inter-module outlining. Three rounds of outlining extract most of the size benefits. Beyond five rounds, there is no benefit at all, but the initial few rounds cannot be discounted. We chose five rounds as the default for the Uber Rider app.
Third, comparing the bottom two lines, it is clear that inter-module (whole program) repeated machine outlining significantly outperforms intra-module outlining. At five rounds of repeats, the whole-program machine outlining delivers 88.42MB code size, whereas doing the same on only individual modules delivers a 100.53MB (13.7%) code size increase.
Production Performance Data
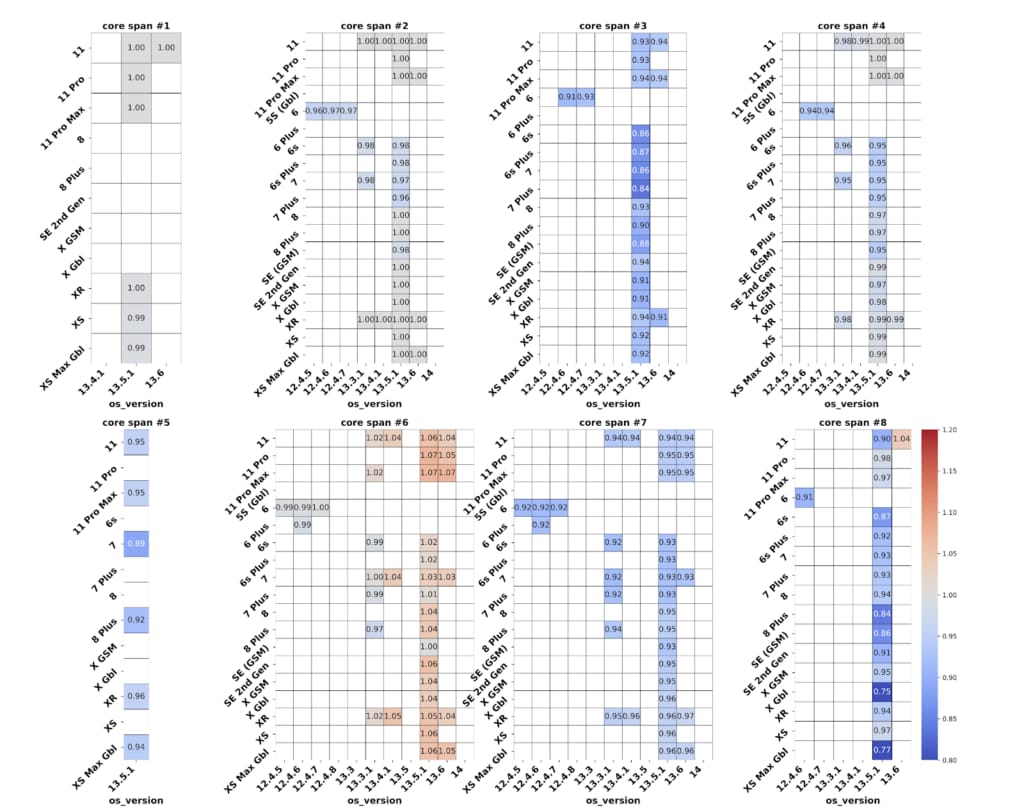
Outlining may degrade performance due to extra branch/call overhead. However, performance gains are also possible because of the reduced instruction footprint. The Uber Rider app is intensive on the User Interface (UI), and our code footprint is heavy. A large fraction of the code is run only once in a typical usage scenario — there is no single “hotspot” code, unlike HPC-style code.
Figure 10 shows the heatmaps for several critical use cases (named core-spans) identified by the Uber Rider app development team. The rows in each span represent different hardware versions, and the columns represent different OS versions. Since the data from production can be noisy, we populate only those cells with > 25K samples, both before and after optimization. The value in each cell is the ratio of the 50th percentile (P50) time to execute the span with our whole-program 5 rounds of repeated machine-code outlining, divided by the time to execute the same span without the optimization; hence, a value greater than 1.0 implies performance regression, and a value less than 1.0 shows performance improvement.
A handful of spans show some performance improvements. On average there is 3.4% performance gain, and in the best case it is 25% for span 8, on 13.5.1 OS on iPhone X Gbl device. There are multiple factors in play: outlining leads to a smaller instruction footprint and hence possibly less icache and iTLB pressure, but it introduces slightly more instructions to accomplish the same quantity of work. We observed a 4% increase in instructions per cycle (IPC) with machine outlining compared to no outlining, which is commensurate with the 3.4% performance gain. Span 6 shows some regression. It is the shortest span with only 0.64 seconds of execution.
In Figure 10, we notice more blue cells indicating overall performance gains. Overall, we see a geometric mean performance gain of 3.4% due to our new pipeline and optimization. Given the volume of real-world data used in the evaluation, we are confident about the conclusions derived, and convinced that machine outlining, when performed with a whole-program pipeline, not only saves app binary size by 23%, but also mildly improves performance by 3.4% for iOS mobile applications with a large code footprint and few code hotspots.
Build Times
We evaluate the compile time on a 10-core iMac Pro (2017) equipped with a 64GB DDR4 running MacOS 10.15.6. The default pipeline builds the app in 21 minutes; the new pipeline with no machine outlining takes 53 minutes, which includes about 7 minutes of llvm-link, 14 minutes opt, 11 minutes of llc and 3 minutes of the system linker. One round of outlining takes about 7 minutes in llc, and 2 rounds take 9 minutes. Each additional round adds progressively less extra time, usually under 30 seconds. Overall, 5 rounds of outlining builds in 66 minutes — a 45-minutes addition to the baseline. Since the build time significantly increases, we do not perform these optimizations at debug build, but only on test and release builds. This strategy does not impact developer productivity, while gaining the benefits of optimization.
Summary
In large apps, such as the Uber Rider app, numerous patterns of machine code repeat due to high-level language features and calling conventions, to name a few common causes. Machine outlining, when applied at the whole-program level, reduces app binary size significantly. Repeatedly applying machine outlining reduces the code size further. Uber has successfully employed these optimizations in production, and have been instrumental in keeping the app size under control, benefitting millions of daily users. The benefits of our optimizations grow over time, making them highly effective for code size reduction and desirable in a fast-growing code base. Our size reduction optimizations have no negative impact on the app performance.
Code size optimization has been at the heart of compiler technology for several decades, but less work has been done to detect missed opportunities in code size. Observing replicated machine-code sequences at the whole-program level opens a new avenue to pinpoint and quantify repeated code patterns and attribute them to various layers of code transformation.
Status
The optimizations discussed herein are either already upstreamed to LLVM or in the process of being upstreamed. https://reviews.llvm.org/D71219 https://reviews.llvm.org/D7102 https://reviews.llvm.org/D71217 https://reviews.llvm.org/D94202
We have presented our work in the LLVM Developers’ meeting in 2019.
A paper describing the technical details of our optimizations and its general applicability is published in the Proceedings of the International Symposium on Code Generation and Optimization (CGO’21) (978-1-7281-8613-9/21/$31.00/©2021 IEEE). Please use the following for citing this work.
Milind Chabbi, Jin Lin, and Raj Barik, “An Experience with Code-Size Optimization for Production iOS Mobile Applications”, In proceedings of the International Symposium on Code Generation and Optimization (CGO’21), Virtual Conference, Feb-Mar 2021.

Milind Chabbi
Milind Chabbi is a Senior Staff Researcher on the Programming Systems Research team at Uber. He leads research initiatives across Uber in the areas of compiler optimizations, high-performance parallel computing, synchronization techniques, and performance analysis tools to make large, complex computing systems reliable and efficient.

Jin Lin
Jin Lin is a senior software engineer in the programming systems group at Uber. He currently works in the area of LLVM and Swift compiler optimizations for code size and performance. In the past he has worked on optimizing compilers and runtime libraries.

Raj Barik
Raj Barik is a former Principal Engineer and TLM in the Programming Systems group at Uber. He led the Programming Systems group and delivered a number of impactful program analysis tools to reduce infrastructure cost, improve code quality, and increase developer velocity. His broad research interests include Programming Languages, Program analysis, Compilers, and Performance optimization tooling.
Posted by Milind Chabbi, Jin Lin, Raj Barik
Related articles
Most popular

Adopting Arm at Scale: Bootstrapping Infrastructure

Adopting Arm at Scale: Transitioning to a Multi-Architecture Environment

A beginner’s guide to Uber vouchers for riders


