Uber এর জলবায়ু মূল্যায়ন এবং কর্মক্ষমতা প্রতিবেদন
Uber- এর প্ল্যাটফর্ম সম্পর্কিত ট্রিপগুলোর পরিবেশগত প্রভাব। আমাদের প্ল্যাটফর্মের বাস্তব-বিশ্ব ব্যবহার থেকে সংগৃহীত ডেটা মূল্যায়ন করে প্রভাব পরিমাপ করা, আরও স্বচ্ছতার জন্য ফলাফলগুলি সর্বজনীনভাবে শেয়ার করা এবং আমাদের জলবায়ু পারফরম্যান্স উন্নত করার জন্য কাজ করা আমাদের দায়িত্ব।
ডিসেম্বর 2024 আপডেট: এই পৃষ্ঠায় ২০২১ সালের প্রথম প্রান্তিকের শুরু থেকে ২০২৪ সালের তৃতীয় প্রান্তিকের শেষ পর্যন্ত অভ্যন্তরীণ কম্বাশন ইঞ্জিন (ICE) গাড়ি এবং জিরো-এমিশন গাড়ি (ZEV, যেমন ব্যাটারি ইভি) দ্বারা Uber-এ সম্পন্ন করা ট্রিপের মেট্রিক্স অন্তর্ভুক্ত রয়েছে। মনে রাখবেন যে এই রিপোর্টের পরিধিতে শুধুমাত্র Uber-এর মবিলিটি ব্যবসা (রাইড শেয়ারিং) অন্তর্ভুক্ত রয়েছে।
“শূন্য নিঃসরণের পথে এগিয়ে যাবার জন্য প্রয়োজন স্বচ্ছতা এবং বছরের পর বছর ধরে দায়বদ্ধ থাকা। গ্রাহকদের দ্বারা বাস্তবিক জগতে আমাদের প্রোডাক্টের ব্যবহার থেকে নিঃসরণের পরিমাপ এবং রিপোর্ট করা প্রথম মোবিলিটি প্ল্যাটফর্ম হতে পেরে Uber গর্বিত।"
দারা খসরোশাহী, প্রধান নির্বাহী কর্মকর্তা (CEO), Uber
ZEV ড্রাইভার
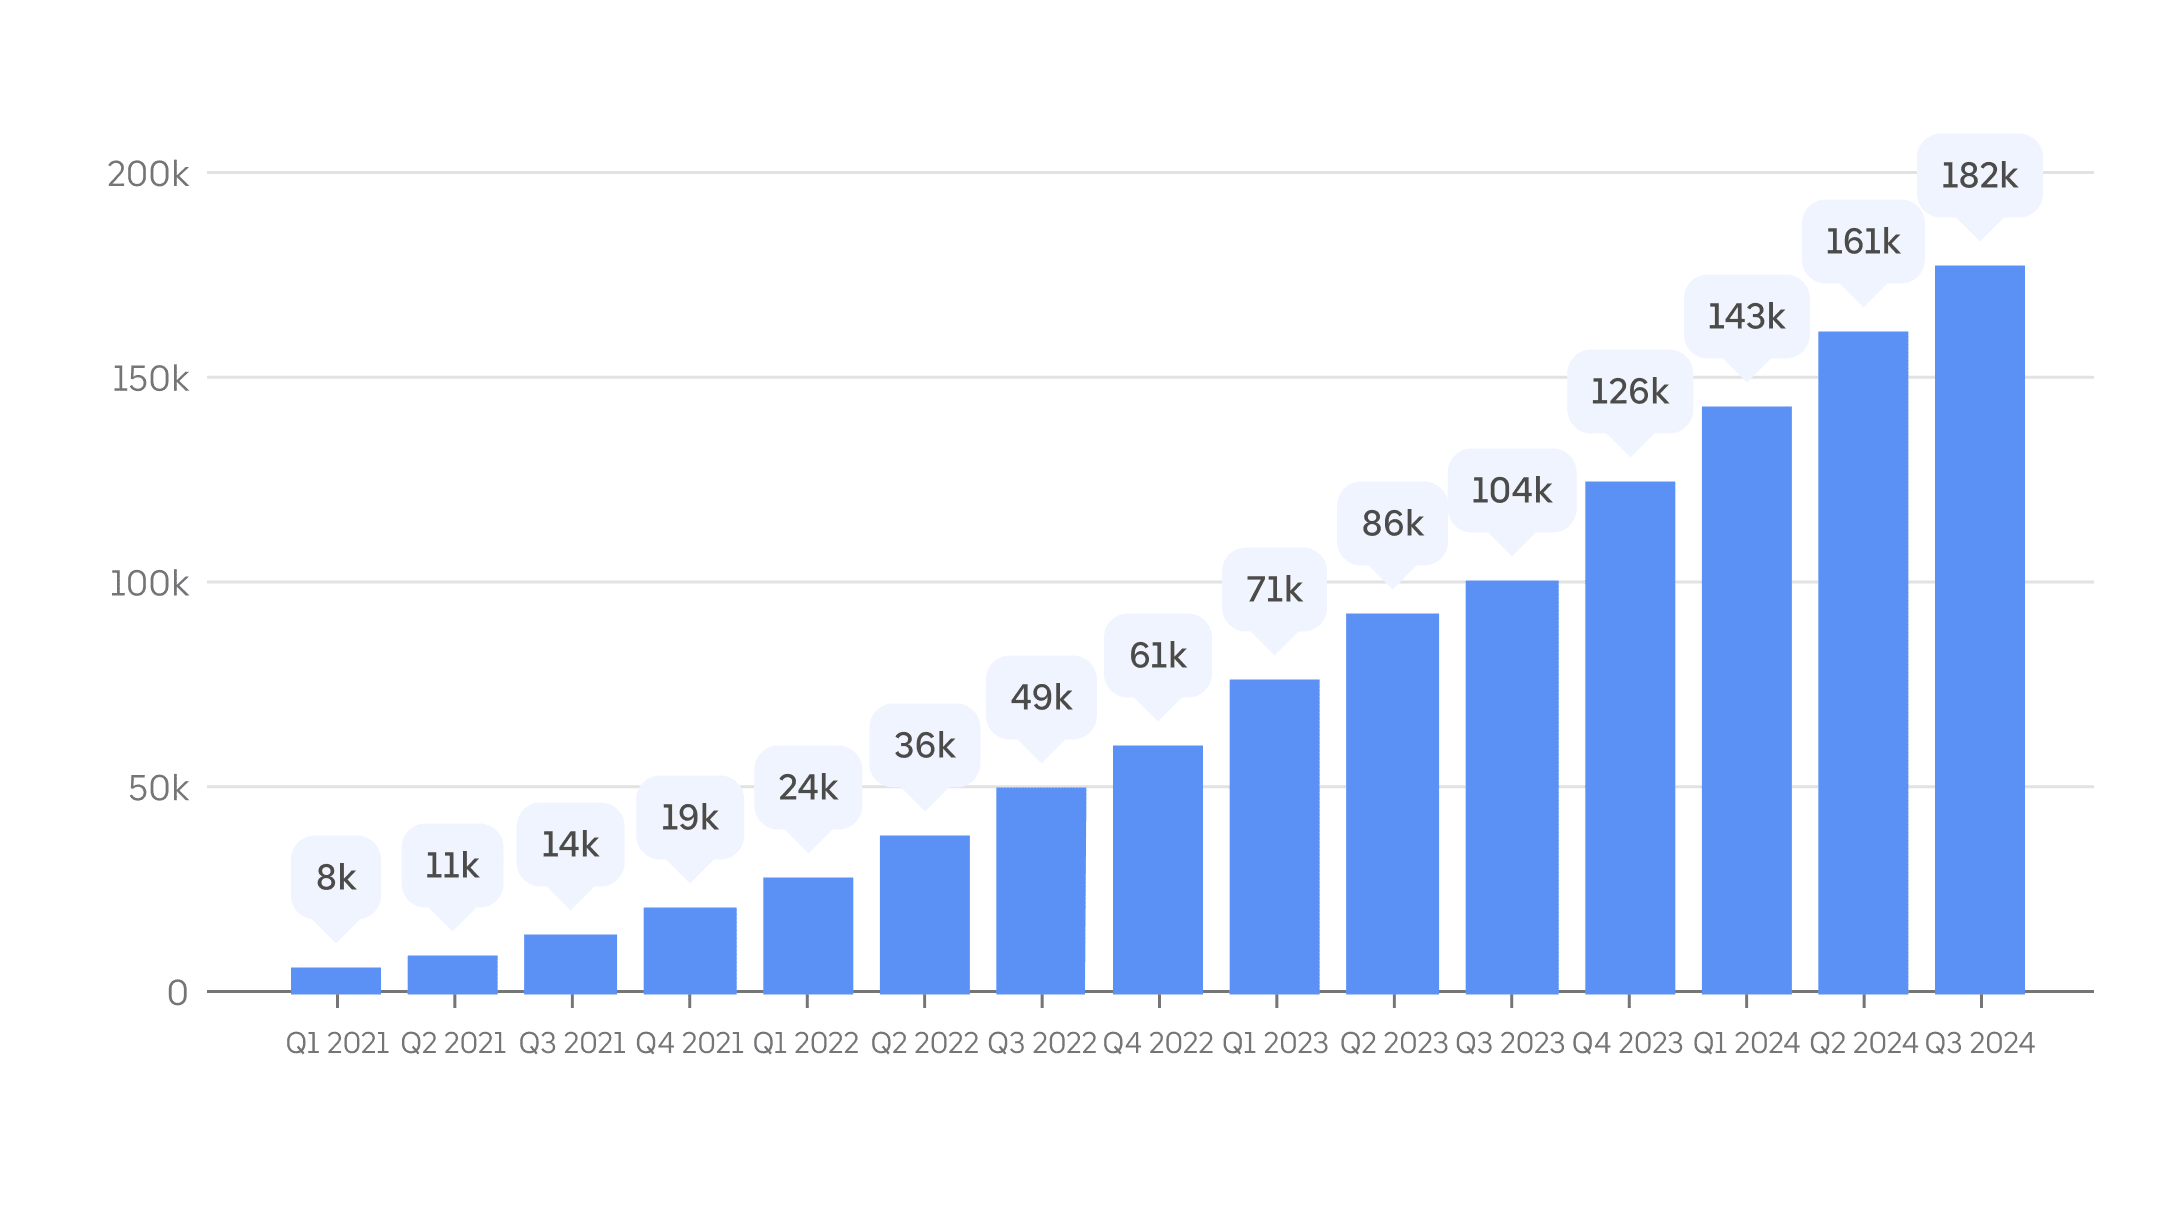
বিশ্বব্যাপী, প্রতি মাসে গড়ে প্রায় 182,000 ZEV ড্রাইভার 2024 সালের তৃতীয় Q3-এ সক্রিয়ভাবে Uber-এর অ্যাপ ব্যবহার করেছেন। এটি এক বছর আগের একই সময়ের তুলনায় 75% বেশি এবং 3 বছর আগের একই সময়ের ��তুলনায় 13 গুণ বেশি।

মেট্রিক Q1 2021 থেকে কোয়ার্টার অনুযায়ী, Uber-এ গড়ে মাসিক সক্রিয় ZEV ড্রাইভারের সংখ্যা, আমাদের ঘোষণা করার পরে প্রথম পূর্ণ ক্যালেন্ডার বছর শুরু হয়েছে টেকসই লক্ষ্য। Uber-এর অ্�যাপ ব্যবহারকারী ড্রাইভাররা যদি সেই ক্যালেন্ডার মাসে কমপক্ষে একটি ট্রিপ সম্পন্ন করে থাকেন তবে তাদেরকে একটি নির্দিষ্ট মাসে সক্রিয় হিসাবে গণ্য করা হয়।
ZEV ট্রিপ
Q3 2024-এ, ZEV ড্রাইভাররা বিশ্বব্যাপী Uber ব্যবহার করে প্রায় 86 মিলিয়ন টেলপাইপ-নির্গমন-মুক্ত ট্রিপ সরবরাহ করেছে। এটি এক বছর আগের একই সময়কালে Uber-এ সম্পন্ন করা ZEV ট্রিপের সংখ্যার চেয়ে 70% বেশি এবং 3 বছর আগের একই সময়ের তুলনায় 14 গুণেরও বেশি।
মেট্রিক মেট্রিক: Uber অ্যাপে সাজানো ট্রিপের সংখ্যা এবং 2021 সাল থেকে ত্রৈমাসিক ZEV ড্রাইভারদের দ্বারা পূরণ করা হয়েছে।
ZEV গ্রহণ করুন
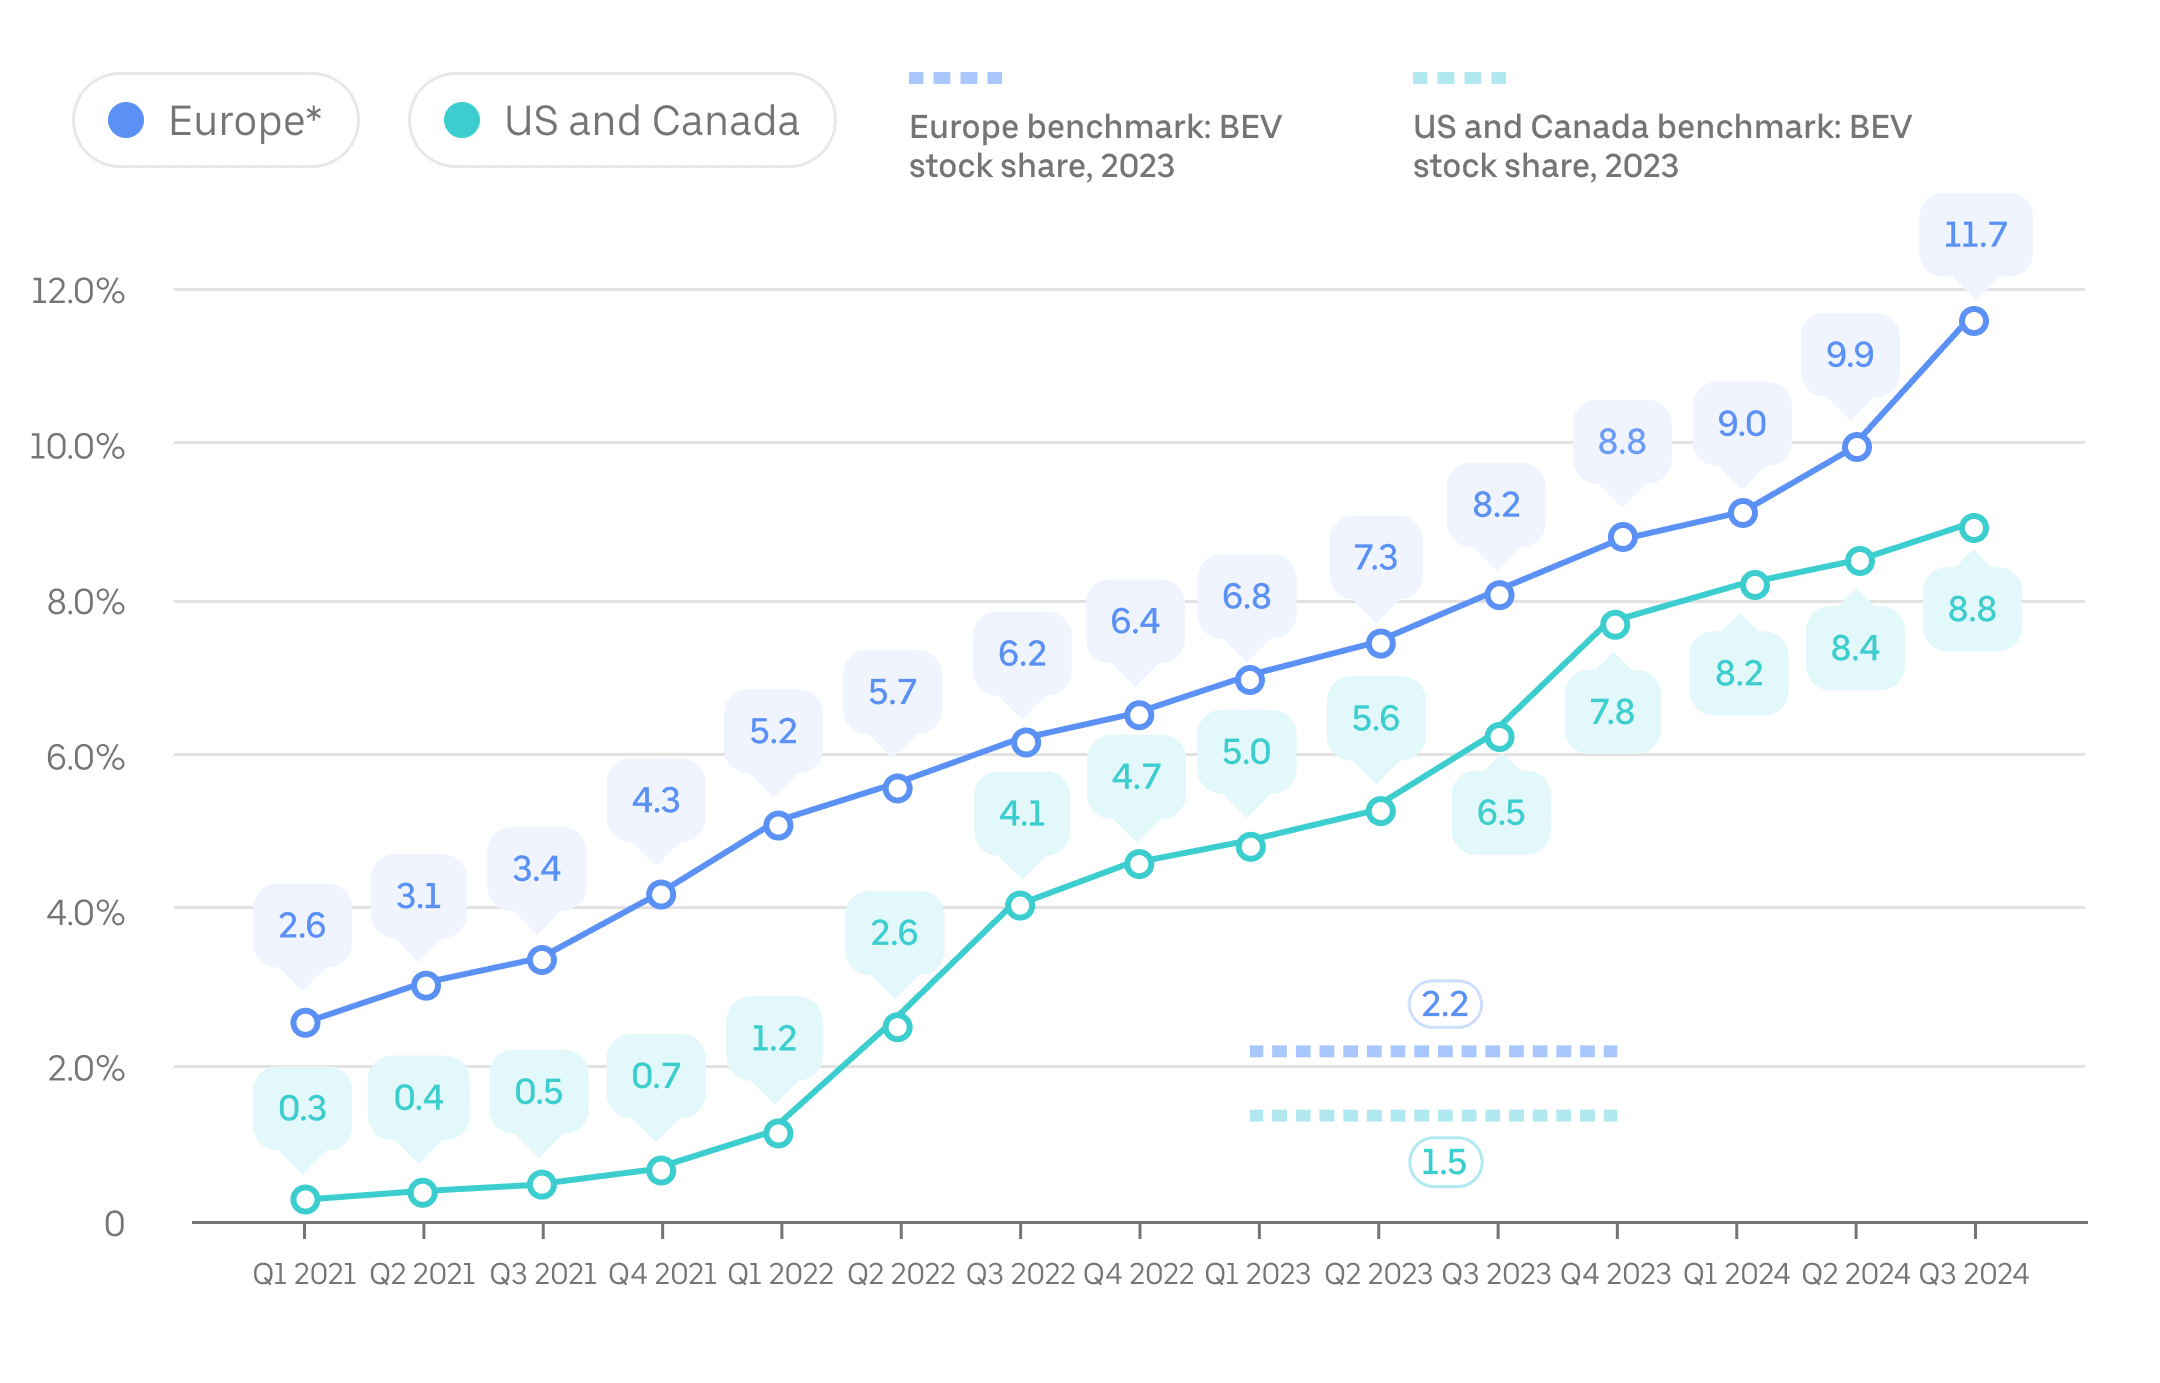
Q3 2024-এ, ZEV ড্রাইভাররা ইউরোপে সমস্ত অন-ট্রিপ মাইলের 11.7% এবং কানাডা এবং মার্কিন যুক্তরাষ্ট্রে সমস্ত অন-ট্রিপ মাইলের 8.8% সম্পন্ন করেছেন। এটি এক বছর আগের একই সময়ের তুলনায় যথাক্রমে 3.5 এবং 2.3 শতাংশ পয়েন্ট বৃদ্ধির প্রতিনিধিত্ব করে। এই ফলাফলগুলি -এ প্রকাশিত পরিসংখ্যানের সাথে সামঞ্জস্যপূর্ণ একটি সাম্প্রতিক ব্লুমবার্গএনইএফ রিপোর্ট যা দেখায় যে ইউরোপে Uber ড্রাইভারদের দ্বারা ZEV গ্রহণের হার সাধারণ জনগণের ড্রাইভারদের তুলনায় প্রায় 5 গুণ বেশি দ্রুততর হচ্ছে।

মেট্রিক মেট্রিক: 2021 সাল থেকে কোয়াটার থেকে Uber অ্যাপে ঠিক করা সমস্ত ট্রিপ মাইলের তুলনায় ZEV-তে সম্পন্ন হওয়া ট্রিপ মাইলের গড় শেয়ার করা। কানাডা, মার্কিন যুক্তরাষ্ট্র এবং ইউরোপীয় বেঞ্চমার্ক ডেটা 2023 অনুযায়ী এবং থেকে নেওয়া হয়েছে ইন্টারন্যাশনাল এনার্জি এজেন্সি। “BEV” বলতে ব্যাটারিচালিত বৈদ্যুতিক গাড়ি বোঝায়।"
যাত্রীর কার্বনের তীব্রতা
2023 সালে, Uber-এ যাত্রীর প্রতিটি মাইল ভ্রমণের ফলে ইউরোপে গড়ে 191 গ্রাম CO₂ (বা প্রতি কিলোমিটারে 119 গ্রাম CO₂) এবং মার্কিন যুক্তরাষ্ট্র এবং কানাডায় 307 গ্রাম CO₂ (বা প্রতি কিলোমিটারে 192 গ্রাম CO₂) পাওয়া গেছে )। 2021 সালের তুলনায়, এই যাত্রী কার্বন তীব্রতা মেট্রিকটি ইউরোপে 16% এবং মার্কিন যুক্তরাষ্ট্র এবং কানাডা জুড়ে 15% হ্রাস পেয়েছে।
মেট্রিক যাত্রীর কার্বনের তীব্রতা, বা প্রতি যাত্রী ভ্রমণ করা মাইল আনুমানিক গ্রাম CO₂, Uber দ্বারা ব্যবহৃত একটি বার্ষিক জলবায়ু এবং দক্ষতার মেট্রিক—এবং, ক্রমবর্ধমানভাবে, বিশ্বজুড়ে সরকার এবং কোম্পানিগুলি। রাইডশেয়ারিং বা যেকোনো অন-ডিমান্ড মোবিলিটি সার্ভিসের ক্ষেত্রে, যেকোনও “ডেডহেড” মাইল—যাত্রী ছাড়াই গাড়ি চালানোর মাইল—এর ফলে উৎপন্ন নির্গমনকে গণনায় বিবেচনা করা হয়।
আমরা কীভাবে যাত্রীর কার্বনের তীব্রতা গণনা করি সে সম্পর্কে আরও তথ্যের জন্য, আমাদের -এ যান পদ্ধতির ডকুমেন্ট। মনে রাখবেন যে ইউরোপে Uber বনাম মার্কিন যুক্তরাষ্ট্র এবং কানাডার গাড়িগুলির জন্য উল্লেখযোগ্যভাবে কম গড় জ্বালানি খরচ এই ২টি ভৌগলিক অঞ্চলে কার্বনের তীব্রতার বেশিরভাগ পার্থক্যকে ব্যাখ্যা করে। যদিও ইউরোপে ড্রাইভাররা Uber-এর অ্যাপে যে গাড়িগুলি ব্যবহার করেন সেগুলির সংমিশ্রণটি আরও দক্ষ, সেখানে ZEV এবং হাইব্রিডের বেশি অনুপাতের সাথে, মার্কিন যুক্তরাষ্ট্রে আরও কঠোর জ্বালানি অর্থনীতি রিপোর্টিং মানগুলিও এই অসঙ্গতিতে অবদান রাখে। এছাড়াও, 2021 সালের আগে ইউরোপের বাজারে সম্পন্ন করা ট্রিপের জন্য যাত্রীর কার্বনের তীব্রতা গণনা করার জন্য আমাদের কাছে পর্যাপ্ত ইনপুট ডেটার অ্যাক্সেস নেই।
অন্তর্দৃষ্টি এবং গভীরে ডুব দেওয়া
সবার পেমেন্ট দিয়ে দিতে পারেন একটি পরিপক্ক প্রযুক্তির ব্যালেন্সড অ্যাডপশন (2024)
মেকিং সাসটেইনেবিলিটি বেটার চয়েস (2024)
ইউরোপে বৈদ্যুতিক গতিশীলতার পরবর্তী পর্যায়ে গাড়ি চালানো (2024)
টেকসই রাউটিং এর মাধ্যমে নির্গমন সাশ্রয় করা (2023)
Uber কীভাবে ড্রাইভারদের ইলেকট্রিক ব্যবহার করতে সহায়তা করে (2022)
ন্যায়সঙ্গত বিদ্যুতায়ন: Uber-Hertz পার্টনারশিপের থেকে প্রাথমিক অনুসন্ধান (2022)
কেন Uber প্রাইভেট গাড়ির থেকে মৌলিকভাবে আলাদা (2021)
কার্বনের তীব্রতার জন্য গতিশীলতা পরিমাপ করা (2019)
রাস্তা শেয়ার করা—ভ্রমণের দক্ষতা (2019)
প্রায়শই জিজ্ঞাসিত প্রশ্নাবলী
- Uber-এর সাম্প্রতিক জলবায়ু মূল্যায়ন এবং পারফরম্যান্স রিপোর্টে কী রয়েছে?
আমাদের জলবায়ু মূল্যায়ন এবং পারফরম্যান্স রিপোর্ট শহরের কর্মকর্তা, পরিবেশ আইনজীবী, ব্যবহারকারী এবং অন্যান্য স্টেকহোল্ডারদের Uber অ্যাপ দ্বারা সক্ষম যাত্রীবাহী গাড়ির ট্রিপের জন্য নির্গমন এবং বিদ্যুতায়নের পারফরম্যান্স-ভিত্তিক মেট্রিক্স সরবরাহ করে।
- আপনি কেন এই রিপোর্ট প্রকাশ করছেন?
Down Small Uber- এর অ্যাপ সম্পর্কিত সমস্ত ট্রিপের পরিবেশগত প্রভাব পারফরম্যান্স সম্পর্কে স্বচ্ছভাবে রিপোর্ট করা এবং এটি উন্নত করার জন্য পদক্ষেপ নেওয়া আমাদের দায়িত্ব। আমাদের অনুমান দেখাচ্ছে যে আমাদের প্ল্যাটফর্ম ব্যবহারের ফলে নির্গমন হল Uber-এর কার্বন ফুট প্রিন্টের মধ্যে সবচেয়ে বাস্তব উপাদান। আমাদের প্ল্যাটফর্মের বাস্তব-বিশ্ব ব্যবহারের উপর ভিত্তি করে তৈরি এই রিপোর্টটি আমাদের জলবায়ু সংক্রান্ত প্রভাব সম্পর্কে আরও বেশি স্বচ্ছতা প্রদানে সহায়তা করে এবং ড্রাইভারদের ZEV-তে ন্যায্য রূপান্তর এবং রাইডের ফলে নির্গমন কমাতে আমাদের প্রচেষ্টাকে উন্নত করতে সহায়তা করে।
আপনি আমাদের প্রথম রিপোর্ট পড়তে পারেন (2020) এখানে এবং আমাদের দ্বিতীয় রিপোর্ট (2021) এখানে. আমাদের 2021 সালের রিপোর্টের পর থেকে, আমরা শুধুমাত্র এই ওয়েব পেজে আপডেট প্রকাশ করেছি।
- জলবায়ু মূল্যায়ন এবং পারফরম্যান্স রিপোর্টে আপনি কী পরিমাপ ব্যবহার করেন?
Down Small - এই রিপোর্টটি কীভাবে Uber-এ রাইডের জন্য নির্গমন হ্রাস এবং বিদ্যুতায়ন গ্রহণকে উন্নত করবে?
Down Small ট্রিপে যাত্রীর কার্বন নিবিড়তা কমানো এবং Uber-এ শূন্য-নির্গমন গাড়ির ব্যবহার বাড়ানো আমাদের সাহসী উচ্চাকাঙ্ক্ষা রয়েছে। আমাদের জলবায়ু মূল্যায়ন এবং পারফরম্যান্স রিপোর্ট শহরের কর্মকর্তা, পরিবেশ আইনজীবী, ব্যবহারকারী এবং অন্যান্য স্টেকহোল্ডারদের Uber অ্যাপ দ্বারা সক্ষম যাত্রীবাহী গাড়ির ট্রিপের জন্য নির্গমন এবং বিদ্যুতায়নের পারফরম্যান্স-ভিত্তিক মেট্রিক্স সরবরাহ করে।
- যাত্রীরা কি কম-কার্বন বিকল্প গুলি ব্যবহার না করে Uber- এ ট্রিপ নেয়?
Down Small যারা রাইড খুঁজছেন তাদের জন্য উপলভ্য অনেক পরিবহন বিকল্পগুলির মধ্যে Uber অ্যাপের রাইডগুলি অন্যতম। ট্রিপ পছন্দ অনেকটাই নির্ভর করে স্থানীয় বাজারের বিভিন্ন অবস্থার উপর। আমাদের বিশ্লেষণ মার্কিন যুক্তরাষ্ট্রের ন্যাশনাল হাউসহোল্ড ট্র্যাভেল সার্ভে ডেটা দেখায় যে সবচেয়ে টেকসই পরিবহন মোডগুলির (ট্রানজিট, হাঁটা এবং বাইকিং) প্রতি পরিবারে উচ্চতর ব্যবহার রাইড শেয়ারিং এবং অন্যান্য অন-ডিমান্ড সমাধানগুলির উচ্চতর ব্যবহারের সাথে সম্পর্কিত।
- আপনি কি বিশ্বের অন্যান্য দেশ বা অঞ্চলের জন্য একই ডেটা পরিমাপ করবেন?
Down Small আমাদের প্রথম রিপোর্ট, 2020 সালে প্রকাশিত, মার্কিন যুক্তরাষ্ট্র এবং কানাডা কভার করে। আমরা আমাদের তে প্রধান ইউরোপীয় বাজার যোগ করেছি দ্বিতীয় রিপোর্ট, 2021 সালে প্রকাশিত হয়েছে। উপরের মেট্রিক্সগুলির মধ্যে অনেকগুলি এখন বিশ্বব্যাপী Uber অ্যাপের মাধ্যমে সম্পন্ন করা সমস্ত যাত্রী ট্রিপগুলিকে কভার করে। আমরা Uber ট্রিপের ফলে জলবায়ু নিঃসরণ এবং অন্যান্য ক্ষেত্রে পড়তে থাকা প্রভাব সম্পর্কে নিয়মিতভাবে রিপোর্ট করার জন্য প্রতিশ্রুতিবদ্ধ। ZEV গ্রহণ এবং যাত্রীর কার্বনের তীব্রতা সহ আমাদের সমস্ত রিপোর্টিং মেট্রিক্সের জন্য সময়ের সাথে সাথে রিপোর্টে কভার করা বাজারগুলির ভৌগলিক পরিধি প্রসারিত করা আমাদের লক্ষ্য।
- আপনি কত ঘন ঘন এই মেট্রিক্স এবং রিপোর্ট আপডেট করবেন?
Down Small আমরা অন্তত বার্ষিক সব মেট্রিক আপডেট করি এবং উপলভ্য হিসাবে কিছু মেট্রিক আরও ঘন ঘন আপডেট করতে পারি। আমরা ক্যালেন্ডারের বছর অনুসারে বার্ষিক নির্গমনের পরিমাপ (যেমন যাত্রী কার্বনের তীব্রতা) প্রকাশ করার পরিকল্পনা করি।
- "শূন্য-নির্গমন গাড়ি" বলতে আপনি কী বোঝেন?
Down Small আমরা "শূন্য-নির্গমন যানবাহন" (ZEV) শব্দটি একইভাবে ব্যবহার করি যেভাবে আমরা ক্যালিফোর্নিয়া এয়ার রিসোর্স বোর্ড (CARB) এবং ইউরোপের পরিবহন & পরিবেশ(T&E) এর মতই একইভাবে "শূন্য-নির্গমন গাড়ি" (ZEV) শব্দটি ব্যবহার করি: বিদ্যুতের উৎস থেকে সরাসরি CO2 নির্গমন বা অন্যান্য মানদণ্ডে বায়ু দূষণকারী (যেমন NOx, পার্টিকুলেট ম্যাটার, CO₂ এবং SOx) উৎপন্ন করে না এমন গাড়িকে উল্লেখ করতে। আঞ্চলিক বৈচিত্র্যগুলি পাঠকের বিবেচনার ভিত্তিতে বিবেচনা করা উচিত।
Uber-এর অ্যাপ ব্যবহারকারী ড্রাইভাররা আজ 2 ধরণের ZEV ব্যবহার করেন: ব্যাটারি ইলেকট্রিক গাড়ি (ব্যাটারি EV) এবং মাঝেমধ্যে, হাইড্রোজেন-চালিত ফুয়েল সেল ইলেকট্রিক গাড়ি (FCEVs)।
অবশ্যই, ZEV-তে "শূন্য" বলতে গাড়ির প্রবাদতুল্য "টেইলপাইপ" থেকে কোনও নির্গমন না হওয়াকে বোঝায় এবং অগত্যা সেই সমস্ত নির্গমনকে বোঝায় যা উৎপাদন থেকে গাড়ির নিষ্পত্তি এবং তার শক্তির উৎস হিসাবে বিবেচনা করা যেতে পারে। তবে, সব হিসাব করা হয়েছে, স্বাধীন বিশেষজ্ঞদের জীবনচক্র বিশ্লেষণ দেখান যে আজ নিবন্ধিত গড় মাঝারি আকারের ব্যাটারি EV-এর জীবদ্দশায় নির্গমন এরমধ্যেই তুলনামূলক পেট্রল গাড়ির তুলনায় ইউরোপে 66%–69%, মার্কিন যুক্তরাষ্ট্রে 60%–68%, চীনে 37%–45%, এবং ভারতে 19%–34%।”
- আপনি কি আপনার Uber Eats, ডেলিভারি এবং Uber Freight ব্যবসায় প্রভাব পরিমাপ করবেন, যা এখন Uber-এর ব্যবসার একটি বড় অংশ তৈরি করে?
Down Small আমাদের জলবায়ু মূল্যায়ন এবং পারফরম্যান্স রিপোর্টে বর্তমানে শুধুমাত্র আমাদের মোবিলিটি ব্যবসার (রাইড শেয়ারিং)-এর জন্য বিদ্যুতায়ন এবং নির্গমন মেট্রিক্স অন্তর্ভুক্ত রয়েছে। আমরা ভবিষ্যতে এই পরিবেশগত স্থায়িত্ব রিপোর্টে আমাদের ডেলিভা��রি এবং মালবাহী ব্যবসাগুলিকে অন্তর্ভুক্ত করার লক্ষ্য রাখি।
ডেলিভারি এবং Uber Freight জুড়ে আমরা কী কী পদক্ষেপ নিচ্ছি তা বুঝতে, অনুগ্রহ করে পরামর্শ করুন Uber-এর ২০২৪ সালের পরিবেশ, সামাজিক এবং প্রশাসনিক রিপোর্ট।
সহ এই সাইট এবং সম্পর্কিত জলবায়ু মূল্যায়ন ও পারফরম্যান্স রিপোর্ট ("রিপোর্ট")-এ আমাদের ব্যবসার কাছ থেকে আগামী দিনে কী প্রত্যাশা করা হতে পারে এবং তা কী লক্ষ্য নিয়ে এগোবে সেই সম্পর্কে ভবিষ্যতমুখী বক্তব্য আছে, যার সঙ্গে জড়িয়ে আছে ঝুঁকি এবং অনিশ্চয়তা। প্রকৃত ফলাফল প্রত্যাশিত ফলাফল থেকে বাস্তবে আলাদা হতে পারে। আরও তথ্যের জন্য, অনুগ্রহ করে আমাদের রিপোর্টটি দেখুন।
এই রিপোর্টে প্রকাশিত কিছু ডেটা LRQA থেকে সীমিত আশ্বাস পেয়েছে। LRQA এর যাচাইকরণ স্টেটমেন্টটিএখানে পাওয়া যাবে।
Uber-এর কার্বন অফসেট ব্যবহারের একটি সংক্ষিপ্ত বিবরণ পাওয়া যাবে এখানে।
"এই রিপোর্টে "ড্রাইভার", "কুরিয়ার", "উপার্জন", শূন্য-নির্গমন গাড়ি" এবং "টেকসই প্যাকেজিং"-এর মতো শব্দের ব্যবহার সাধারণ এবং Uber Technologies, Inc-এর সাধারণ ব্যবহারের ক্ষেত্রে এই শব্দগুলি অনুসরণ করা হয়।" শব্দের আঞ্চলিক পরিবর্তনগুলি পাঠকের বিবেচনার ভিত্তিতে বিবেচনা করা উচিত।
সম্পর্কিত
