تقرير تقييم المناخ والأداء الخاص بأوبر
يُعد التأثير البيئي للمشاوير التي تُجريها من خلال منصة أوبر أمراً مهماً. تقع على عاتقنا مسؤولية قياس ذلك التأثير من خلال تقييم البيانات المُجمَّعة من الاستخدام الفعلي لأوبر، ومشاركة النتائج علناً لتحقيق مزيدٍ من الشفافية، والعمل على تحسين أدائنا للحفاظ على المناخ.
تحديث نوفمبر 2024: تتضمن هذه الصفحة مقاييس المشاوير التي تم إكمالها في أوبر باستخدام وسائل التنقل التي تعمل بمحركات الاحتراق الداخلي (ICE) ووسائل التنقل منعدمة الانبعاثات (ZEVs، مثل وسائل التنقُّل الكهربائية التي تعمل بالبطاريات) من بداية الربع الأول من عام 2021 إلى نهاية الربع الثالث من عام 2024. لاحِظ أن نطاق هذا التقرير يشمل أعمال أوبر للتنقل فقط (مشاركة المشاوير).
"يتطلب الطريق إلى القضاء على الانبعاثات الضارة الالتزام بالشفافية والمسؤولية تجاه تحقيق التقدم عاماً بعد عام. وتفخر أوبر بكونها أول تطبيق للتنقُّل يقيس الانبعاثات الضارة الناتجة عن استخدام العملاء الفعلي لمنتجاتنا والإبلاغ عنها".
دارا خسروشاهي، المدير التنفيذي لشركة أوبر
الشركاء السائقون للمركبات منعدمة الانبعاثات (ZEV)
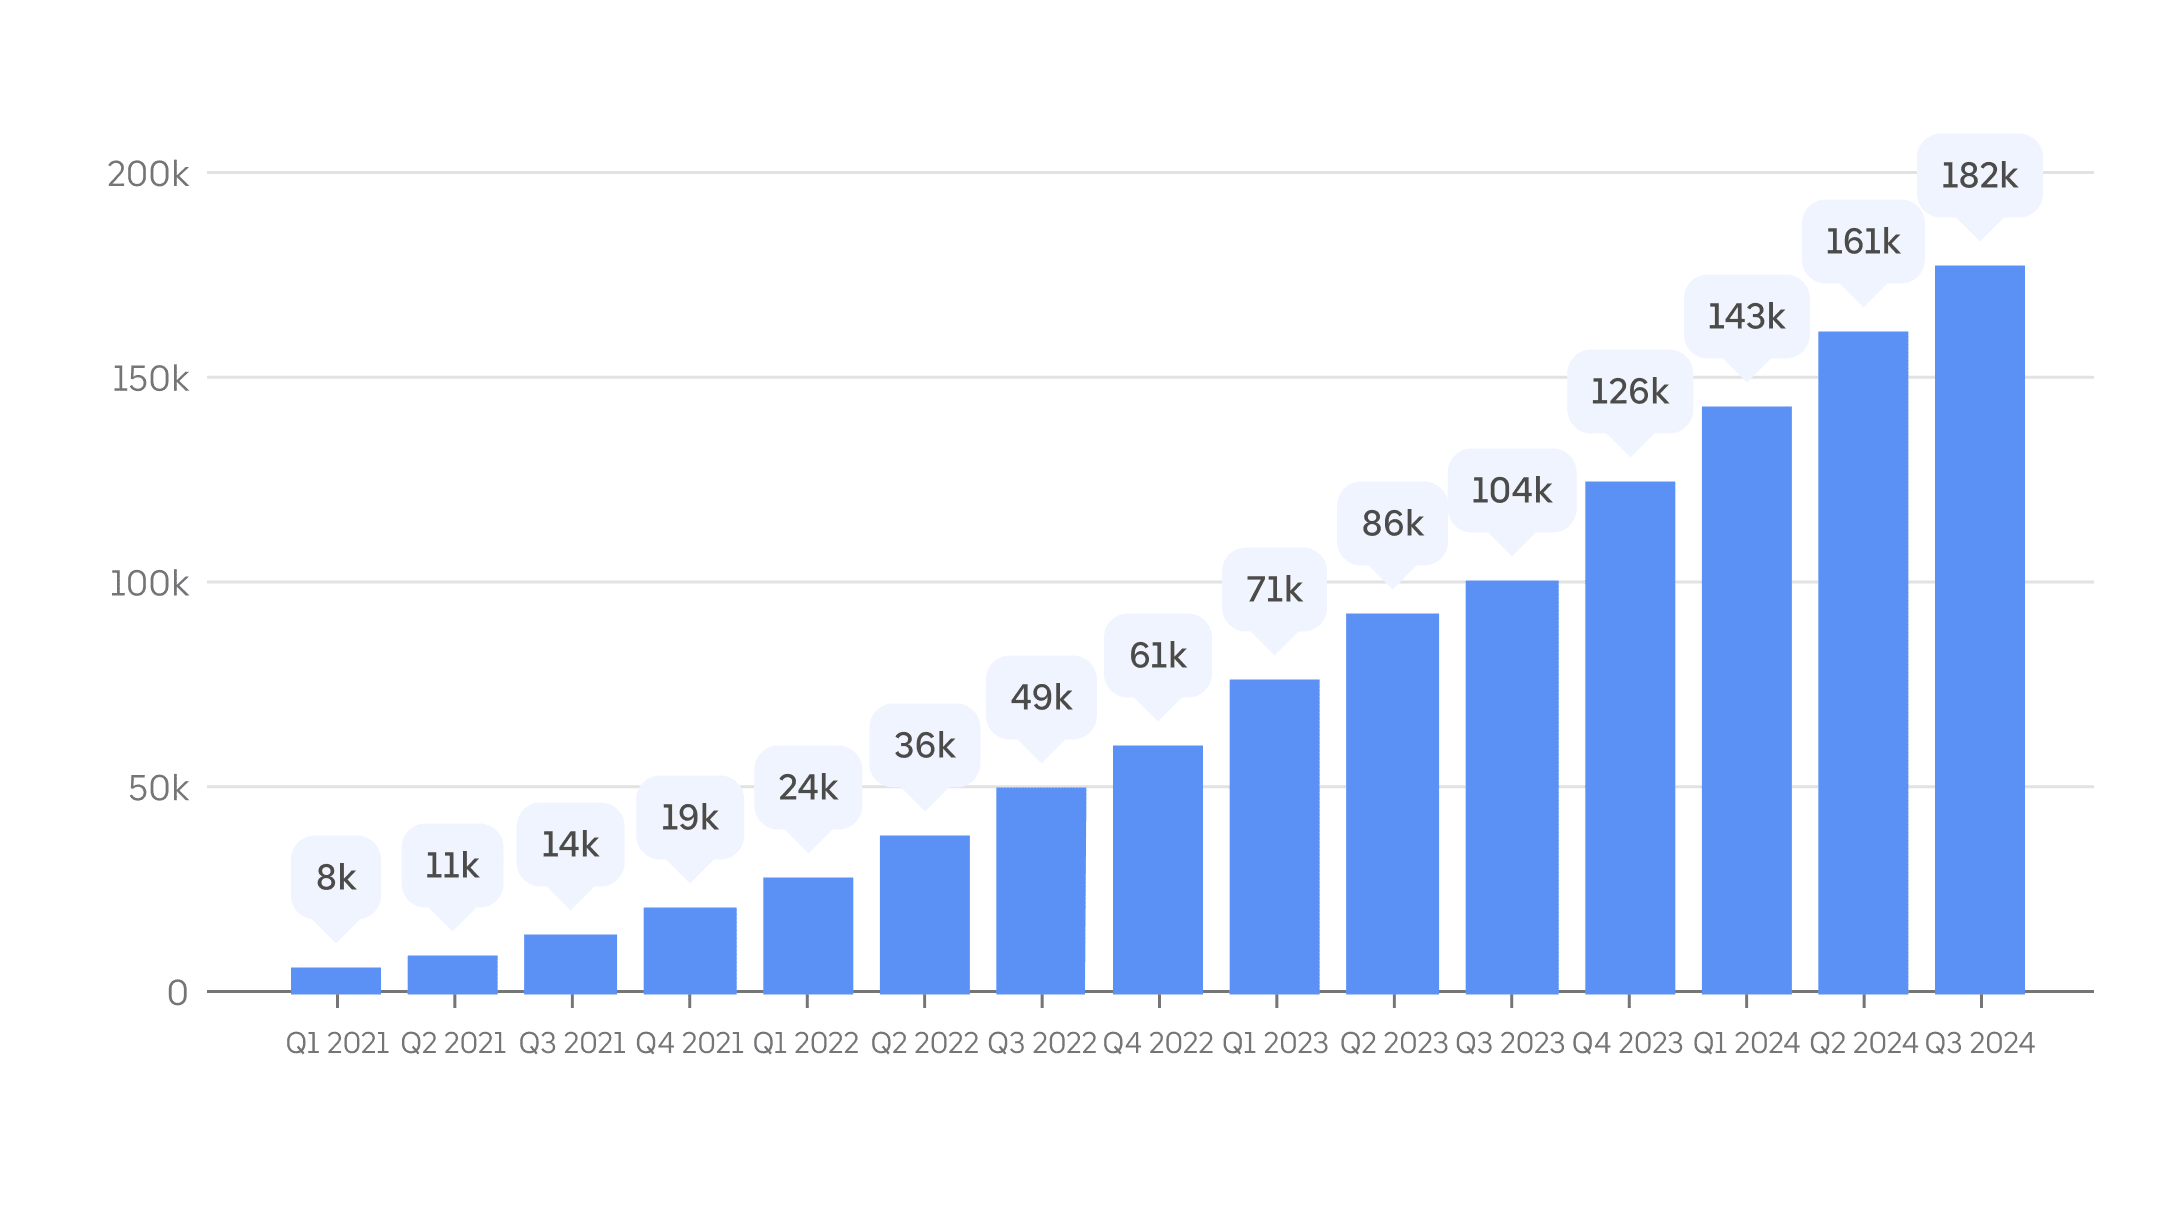
بلغ متوسط عدد الشركاء السائقين لوسائل التنقل منعدمة الانبعاثات الذين استخدموا تطبيق أوبر 182 ألف شريك سائق شهرياً على مستوى العالم خلال الربع الثالث من عام 2024. ويمثل هذا زيادة بنسبة 75% مقارنة بنفس الفترة من العام الماضي، و13 ضعفاً مقارنة بنفس الفترة قبل 3 أعوام.

المقياس: متوسط عدد الشركاء السائقين النشطين شهرياً في استخدام وسائل التنقل منعدمة الانبعاثات على تطبيق أوبر، وفقاً للربع السنوي، واعتباراً من الربع الأول لعام 2021، وهو بداية أول عام تقويمي كامل بعد إعلاننا لأهداف الاستدامة. يُصنف الشركاء السائقون المستخدمون لتطبيق أوبر على أنهم نشطون شهرياً إذا أكملوا مشواراً واحداً على الأقل خلال الشهر.
المشاوير باستخدام المركبات منعدمة الانبعاثات (ZEV)
في الربع الثالث من عام 2024، أجرى الشركاء السائقون في أوبر ما يقرب من 86 مليون مشوار خالٍ من الانبعاثات باستخدام وسائل تنقل منعدمة الانبعاثات. ويمثل هذا زيادة بنسبة 70% للمشاوير المكتملة التي تمت باستخدام وسائل تنقل منعدمة الانبعاثات في أوبر، مقارنة بالفترة نفسها من العام الماضي، و14 ضعفاً مقارنة بنفس الفترة قبل 3 أعوام.
المقياس: عدد المشاوير التي تم طلبها باستخدام تطبيق أوبر وأجراها الشركاء السائقون باستخدام وسائل تنقل منعدمة الانبعاثات، كل ثلاثة أشهر منذ الربع الأول في عام 2021.
الإقبال على استخدام المركبات منعدمة الانبعاثات (ZEV)
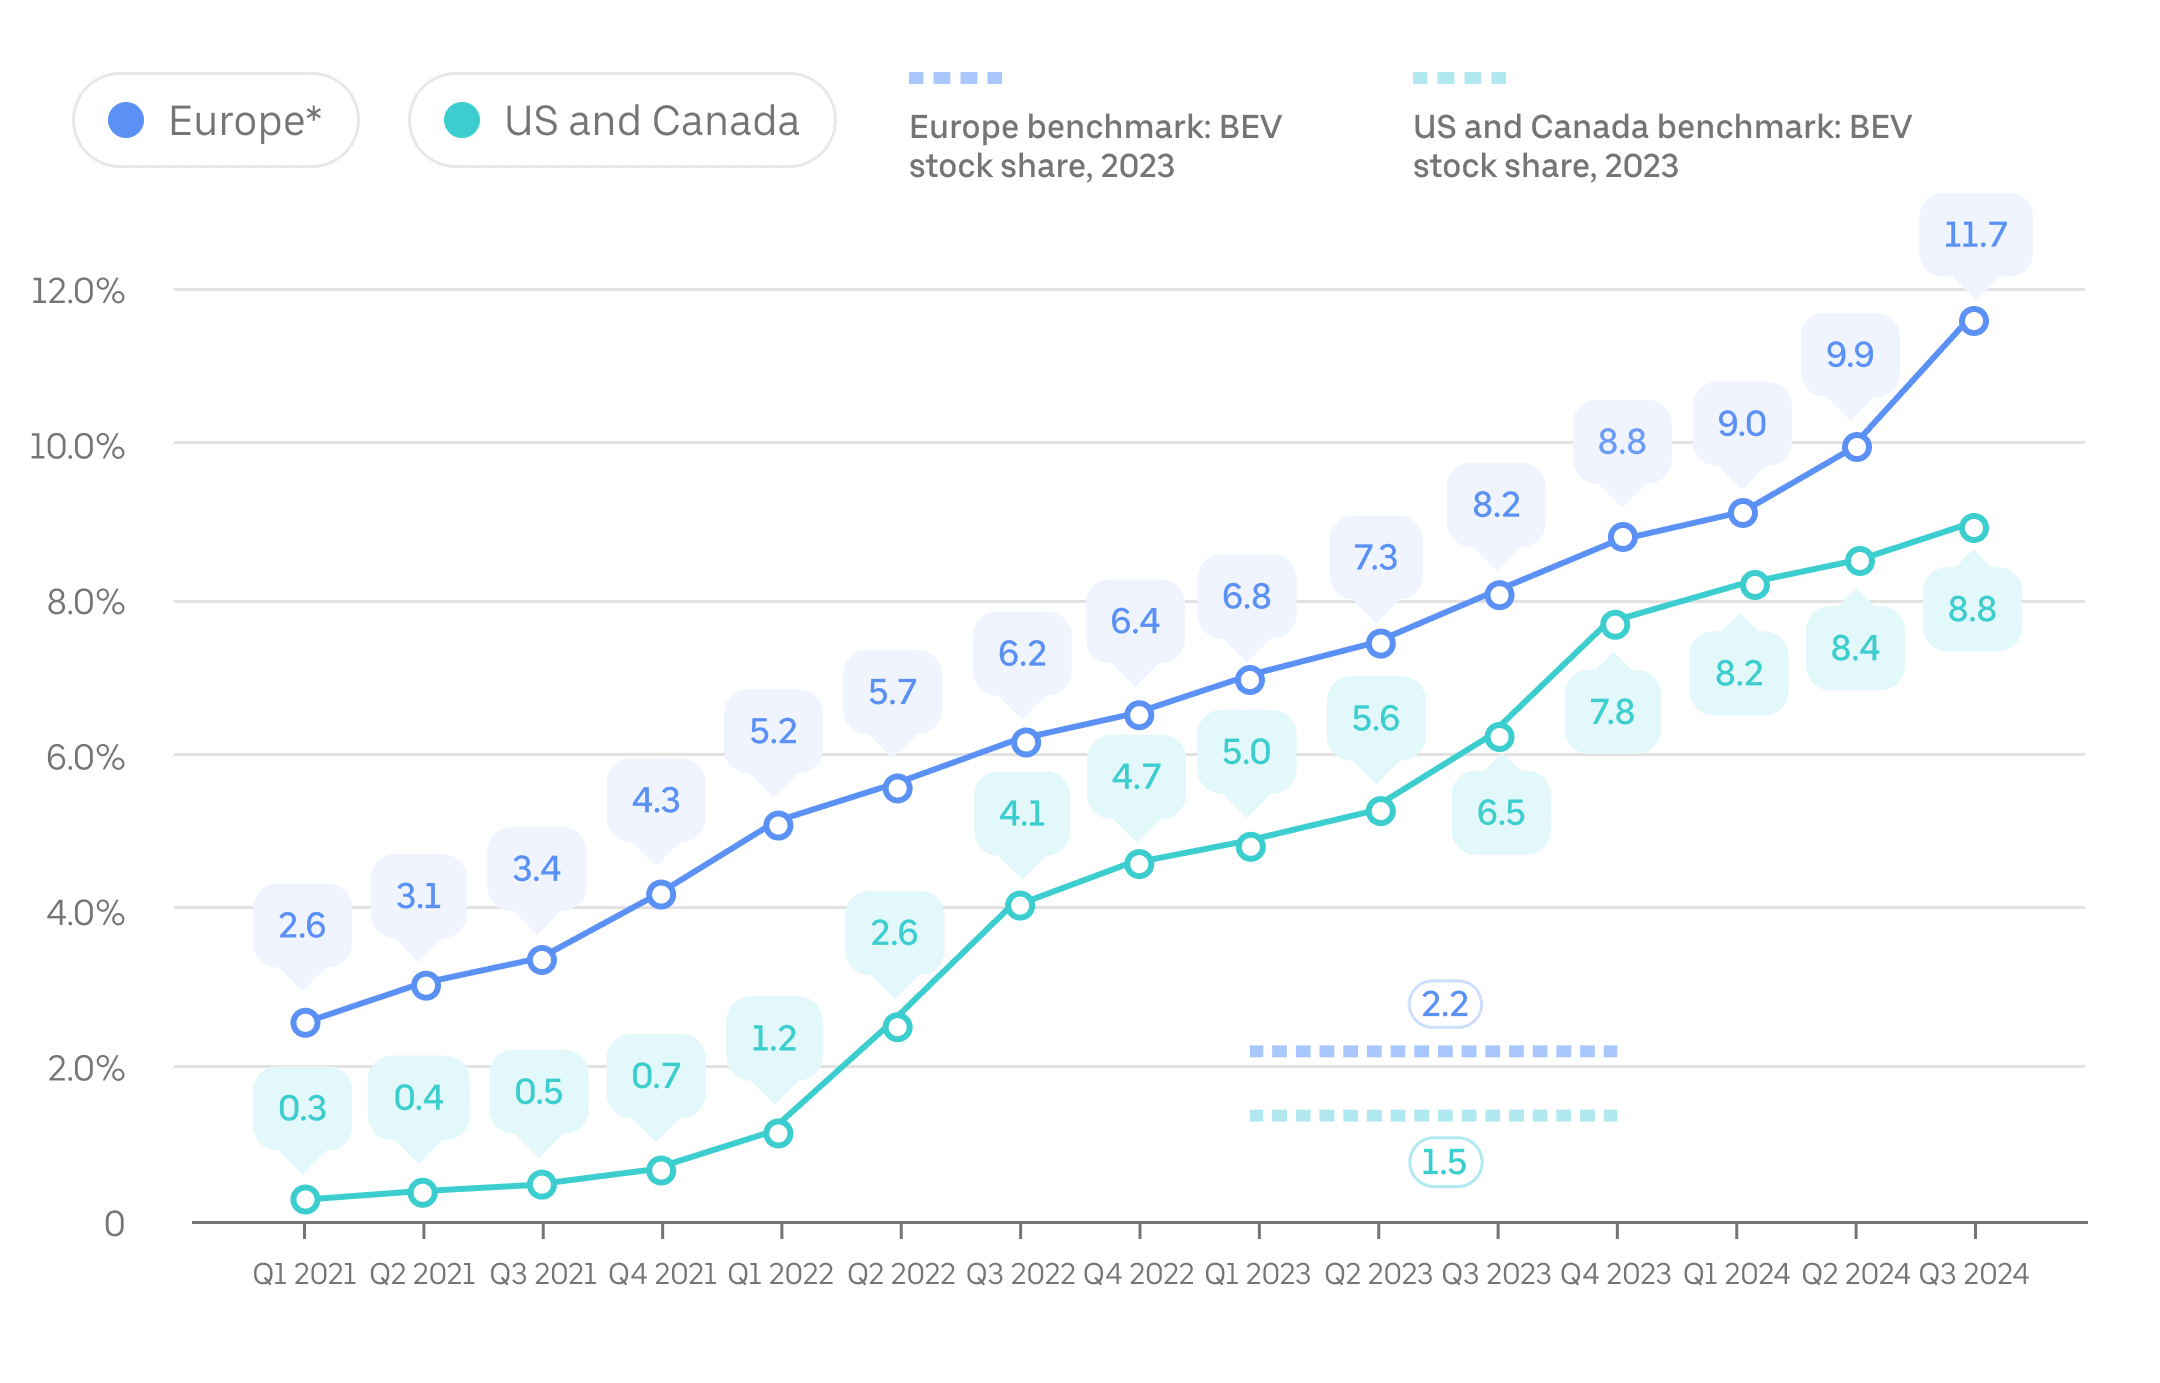
في الربع الثالث من عام 2024، قطع الشركاء السائقون الذين يستخدمون وسائل التنقل منعدمة الانبعاثات نسبة 11.7% من إجمالي الكيلومترات المقطوعة في المشاوير بأوروبا، و8.8% من إجمالي الكيلومترات المقطوعة في المشاوير بكندا والولايات المتحدة. ويمثل ذلك زيادة قدرها 3.5 و 2.3 نقطة مئوية على التوالي، مقارنة بنفس الفترة من العام السابق. تتطابق هذه النتائج مع الأرقام المنشورة في تقرير BloombergNEF الأخير، الذي يُظهر أن اعتماد الشركاء السائقين في أوبر بأوروبا على وسائل التنقل منعدمة الانبعاثات يحدث بسرعة تفوق اعتماد السائقين في عموم الناس بحوالي خمس مرات.

المقياس: نسبة الكيلومترات المقطوعة في المشاوير باستخدام وسائل التنقل منعدمة الانبعاثات مقارنةً بإجمالي الكيلومترات المقطوعة في جميع المشاوير التي تمت عبر تطبيق أوبر، بشكل ربع سنوي منذ الربع الأول من عام 2021. تستند البيانات المعيارية لكندا والولايات المتحدة وأوروبا إلى عام 2023، ومصدرها وكالة الطاقة الدولي�ة. يشير مصطلح "BEV" إلى وسائل التنقل الكهربائية التي تعمل بالبطارية.
كثافة الانبعاثات الكربونية للراكب
في عام 2023، نتج عن كل كيلومتر قطعه الراكب باستخدام أوبر في المتوسط 191 جراماً من ثاني أكسيد الكربون في أوروبا (أو 119 جراماً من ثاني أكسيد الكربون لكل كيلومتر)، و307 جرامات من ثاني أكسيد الكربون في الولايات المتحدة وكندا (أو 192 جراماً من ثاني أكسيد الكربون لكل كيلومتر). مقارنة بعام 2021، انخفض مقياس كثافة الانبعاثات الكربونية للراكب بنسبة 16% في أوروبا و15% في جميع أنحاء الولايات المتحدة وكندا.
المقياس: يشير مصطلح كثافة الانبعاثات الكربونية للراكب، والذي يمثل الجرامات المقدرة لثاني أكسيد الكربون لكل كيلومتر يقطعه الراكب، إلى مقياس سنوي للمناخ والكفاءة تستخدمه أوبر، ويزداد استخدامه لدى الحكومات والشركات حول العالم. عند حساب كثافة الانبعاثات في خدمات مشاركة المشاوير أو التنقل حسب الطلب، يتم أخذ الانبعاثات الناتجة عن كيلومترات "التنقل بدون ركاب" في الاعتبار — وهي المسافة التي تقطعها وسيلة التنقل دون وجود ركاب
لمزيد من التفاصيل حول كيفية حساب كثافة الانبعاثات الكربونبة للراكب، انتقِل إلىمستند المنهجية. لاحِظ أن الجزء الأكبر من الفرق في الكثافة الكربونية بين أوروبا والولايات المتحدة وكندا يعود إلى انخفاض متوسط استهلاك الوقود بشكل ملحوظ لوسائل التنقل في أوبر في هاتين المنطقتين الجغرافيتين. على الرغم من أن وسائل التنقل التي يستخدمها الشركاء السائقون في تطبيق أوبر في أوروبا تتمتع بكفاءة أعلى، مع زيادة ملحوظة في استخدام وسائل النقل منعدمة الانبعاثات والهجينة، فإن المعايير الأكثر صرامة للإبلاغ عن اقتصاد الوقود في الولايات المتحدة تساهم أيضاً في هذا الفارق. بالإضافة إلى ذلك، لا تتوفر لدينا بيانات كافية لحساب كثافة الانبعاثات الكربونية للراكب في المشاوير التي تمت في المناطق الأوروبية قبل عام 2021.
التحليلات والمعلومات التفصيلية
وسائل تنقُّل كهربائية للجميع: التبني المدروس لتقنية راسخة (2024)
نسعى إلى جعل الاستدامة الخيار الأفضل (2024)
قيادة المرحلة المقبلة للتنقل الكهربائي في أوروبا (2024)
خفض الانبعاثات من خلال المسارات المستدامة (2023)
كيف تساعد أوبر الشركاء السائقين على التحول إلى إجراء المشاوير بسيارات كهربائية (2022)
إجراء المشاوير بسيارات كهربائية على نحو عادل: النتائج الأولية للشراكة بين أوبر وهرتز (2022)
ما سبب تميُّز وسائل تنقُّل أوبر عن السيارة الخاصة (2021)
قياس خدمات التنقُّل لكثافة انبعاثات الكربون (2019)
مشاركة الطريق - كفاءة التنقُّل (2019)
الأسئلة الشائعة
- ما هو أحدث تقرير لتقييم المناخ والأداء في أوبر؟
يُقدم تقرير أوبر لتقييم المناخ والأداء لمسؤولي المدن، والمدافعين عن البيئة، والمستخدمين، وغيرهم من أصحاب المصلحة، مقاييس أداء عن الانبعا�ثات ومدى انتشار وسائل التنقل الكهربائية في مشاوير الركاب التي تتم عبر تطبيق أوبر.
- لماذا تنشر هذا التقرير؟
Down Small إننا نضع في اعتبارنا التأثير البيئي للمشاوير التي يتم إجراؤها باستخدام تطبيق أوبر. ونتحمل مسؤولية الإبلاغ عن الأداء بشفافية واتخاذ الإجراءات اللازمة لتحسينه. تُظهر تحليلاتنا أن الانبعاثات الناتجة عن استخدام تطبيقنا من أكبر العوامل المُسبِّبة لزيادة الأثر الكربوني لشركة أوبر. ويساعد هذا التقرير، المستند إلى الاستخدام الفعلي لتطبيقنا، في توفير قدر أكبر من الشفافية بشأن تأثير خدماتنا في المناخ، كما يساعدنا في تعزيز جهودنا للحدّ من الانبعاثات الناتجة عن المشاوير ودعم الشركاء السائقين لتوفير ظروف عادلة تساعدهم في الاتجاه نحو استخدام وسائل تنقُّل منعدمة الانبعاثات.
يمكنك الاطِّلاع على تقريرنا الأول (2020) عبر هذا الرابط وتقريرنا الثاني (2021) عبر هذا الرابط. منذ نشر تقريرنا لعام 2021، اقتصر نشر المستجدات على صفحة الويب هذه فقط.
- ما هي المقاييس الرئيسية التي تستخدمها في تقرير تقييم المناخ والأداء؟
Down Small تتضمن المقاييس ما يلي:
- استخدام الشركاء السائقين في أوبر لوسائل التنقل منعدمة الانبعاثات (نسبة الأميال أو الكيلومترات المقطوعة للمشاوير بوسائل التنقل منعدمة الانبعاثات (ZEV))، حيث يقيس مدى التقدم المُحرز نحو هدفنا المتمثل في تنقُّل خالٍ من الانبعاثات بنسبة 100% في أوبر عالمياً بحلول عام 2040
- كثافة الانبعاثات الكربونية للراكب، حيث يقيس الانبعاثات الناتجة عن كل كيلومتر يقطعه الراكب في المشاوير
- كيف يُمكن لهذا التقرير أن يعمل على تقليل الانبعاثات وتشجيع استخدام وسائل التنقل الكهربائية في مشاوير أوبر؟
Down Small نطمح بشدة إلى تقليل كثافة الانبعاثات الكربونية للراكب في المشاوير وزيادة استخدام وسائل التنقُّل منعدمة الانبعاثات في أوبر. إن قياس نتائج ما يتم إدارته والتحلي بالشفافية حول التقدم المحرز هما خطوتان أساسيتان في المسيرة.
- هل يجري الركاب المشاوير باستخدام أوبر بدلاً من الخيارات التي تساهم في تقليل الانبعاثات الكربونية، مثل وسائل النقل العام؟
Down Small تُعدّ المشاوير باستخدام تطبيق أوبر أحد خيارات وسائل التنقل العديدة المتوفِّرة للأشخاص الذين يبحثون عن مشوار. يعتمد اختيار المشوار إلى حد كبير على ظروف السوق المحلية المتنوعة. يُبين تحليلنا لبيانات استطلاع الرأي الوطني الأمريكي لتنقل الأُسر عن أن الأُسر التي تستخدم وسائل النقل المستدامة (المواصلات العامة، المشي، ركوب الدراجات) بمعدلات أعلى تميل أيضاً إلى استخدام خدمات مشارك�ة المشاوير وخدمات التنقل حسب الطلب بشكل أكبر.
- هل ستقيس البيانات نفسها للبلدان أو المناطق الأخرى حول العالم؟
Down Small تناول تقريرنا الأول، الصادر في عام 2020، الولايات المتحدة وكندا. وأضفنا الأسواق الأوروبية الرئيسية إلى تقريرنا الثاني، الصادر في عام 2021. أصبحت معظم المقاييس المذكورة سابقاً تغطي الآن جميع مشاوير الركاب التي يتم إتمامها عبر تطبيق أوبر على مستوى العالم. ملتزمون بإعداد تقارير دورية حول انبعاثات المناخ وغيرها من التأثيرات الناتجة عن مشاوير أوبر. نسعى إلى توسيع التغطية الجغرافية للأسواق التي يشملها التقرير تدريجياً لتشمل جميع مقاييس التقارير لدينا، بما في ذلك استخدام وسائل التنقل منعدمة الانبعاثات والكثافة الكربونية للراكب.
- كم مرة تُحدَّث فيها هذه المقاييس والتقرير؟
Down Small يتم تحديث جميع المقاييس على الأقل مرة سنوياً، وقد يخضع بعضها لتحديثات بشكل أكثر تكراراً. سنُصدر مقاييس للانبعاثات (مثل كثافة الانبعاثات الكربونية للراكب) سنوياً، على أن يتم تجميعها في نهاية السنة التقويمية.
- ماذا تعني "المركبات منعدمة الانبعاثات"؟
Down Small نستخدم مصطلح "وسيلة التنقل منعدمة الانبعاثات" (ZEV) بنفس الطريقة المُتبعة في مجلس موارد الهواء في ولاية كاليفورنيا (CARB) والاتحاد الأوروبي للنقل والبيئة (T&E): للإشارة إلى وسائل التنقل التي لا تصدر انبعاثات مباشرة لثاني أكسيد الكربون أو غيرها من ملوثات الهواء المعيارية الأخرى (مثل الأكاسيد أحادية النيتروجين والمواد الدقيقة وثاني أكسيد الكربون وأكسيد الكبريت) المنبعثة من مصدر الطاقة الموجود فيها. تخضع الاختلافات الإقليمية لتقدير القارئ.
يستخدم الشركاء السائقون في أوبر نوعين من وسائل التنقل منعدمة الانبعاثات (ZEVs) في يومنا هذا: وسائل التنقل الكهربائية التي تعمل بالبطارية (battery EVs)، وفي بعض الأحيان، وسائل التنقل الكهربائية ذات خلايا الوقود التي تعمل بالهيدروجين (FCEVs).
من المؤكد، أن مفهوم "منعدمة" في وسائل التنقل منعدمة الانبعاثات يقتصر على الانبعاثات الصادرة من عادم وسيلة التنقل، ولا يشمل بالضرورة جميع الانبعاثات الأخرى المرتبطة بعملية تصنيع وسيلة التنقل، والتخلص منها، ومصدر طاقتها. ومع ذلك، مع أخذ جميع العوامل في الاعتبار، تُظهر تحليلات دورة الحياة التي أجراها خبراء مستقلون أن "الانبعاثات على مدار دورة حياة وسائل التنقل الكهربائية ذات البطاريات متوسطة الحجم المُسجلة اليوم أقل بالفعل من وسائل التنقل التي تعمل بالبنزين بنسبة تتراوح بين 66% و69% في أوروبا، وبين 60% و68% في الولايات المتحدة، وبين 37% و45% في الصين، وبين 19% و34% في الهند."
- هل ستعمل على قياس حجم التأثير الواقع على أعمالك في أوبر إيتس (Uber Eats) وخدمات التوصيل وخدمات Uber Freight، التي تُشكِّل الآن جزءاً كبيراً من أعمال أوبر؟
Down Small يغطي تقرير تقييم المناخ والأداء لدينا حالياً مقاييس عن مدى انتشار وسائل التنقل الكهربائية والانبعاثات فقط لأعمالنا المتعلقة بالتنقل (مشاركة المشاوير). نسعى لتوسيع نطاق تقرير الاستدامة البيئية ليشمل أنشطة التوصيل والشحن لأوبر في المستقبل.
للاطلاع على الخطوات التي نتخذها في قطاعي خدمة التوصيل وUber Freight، من فضلك اطَّلِع على تقرير أوبر للاستدامة البيئية والاجتماعية والحوكمة لعام 2024.
تتضمن هذه الصفحة وتقارير تقييم المناخ والأداء وتقارير الحوكمة البيئية والاجتماعية ("التقرير") على بيانات تطلعية بشأن توقعاتنا وأهدافنا المستقبلية للأعمال، مع مراعاة المخاطر والشكوك. وقد تختلف النتائج الفعلية عن النتائج المتوقعة اختلافاً جوهرياً. للمزيد من المعلومات، تفضَّل بالاطِّلاع على تقاريرنا.
تلقت بعض البيانات الواردة في هذا التقرير ضماناً محدوداً من شركة لويدز ريجستر لضمان الجودة (LRQA). يمكن الاطلاع على بيان التحقق الصادر من شركة لويدز ريجستر لضمان الجودة (LRQA) هنا.
يمكن الاطلاع على نبذة عامة حول ممارسات أوبر لتعويضات الكربون هنا.
المصطلحات المستخدمة في هذا التقرير، مثل "الشركاء السائقين"، "شركاء التوصيل"، "تحقيق الأرباح"، "وسائل التنقل منعدمة الانبعاثات"، و"التعبئة المستدامة"، هي مصطلحات عامة وتتوافق مع الاستخدام القياسي لهذه الكلمات في شركة أوبر تكنولوجيز. تخضع الاختلافات الإقليمية للكلمات لتقدير القارئ.
معلومات تعريفية
